Friday 18 March 2022

27 - Building and Characterising a RF Two Tone Generator and a Switched Attenuator

 Building and Characterising a RF Two Tone Generator and a Switched Attenuator


I am building a uBitx SSB Transceiver and want to test each module using simple test gear. A NanoVNA can do quite a lot but sometimes you need to apply two RF signals quite close together and see what the output contains on a spectrum analyser – I plan to use my SDRPlay software defined radio receiver and run the RSP Spectrum analyser software available on SDRPlays’ website.

One of the two or three books I consider the bibles of Homebrew is “Building a Transceiver” by Eamon Skelton EI9GQ and Elaine Richards G4LFM available in the RSGB Store. It covers construction of a two-tone generator using two simple crystal oscillators, low pass filters and a simple combiner. I reproduce Eamon’s circuit here but do get the book if constructing it.

You need to build two of these, I built each of mine in an Altoids mint tin using small squares of PCB glued onto a PCB substrate – this type of bread boarding is quicker and easier than making PCBs for small RF projects and gives excellent results as the circuit is above a ground plane. Shielding is important in this circuit and you don’t want extraneous pickup from leakage.

Build two of these. I added a small inductor in series with one of the crystals. Use any similar pair of crystals.


to the Altoid tins used feedthrough capacitors and I used short lengths of Coax to take the two signal generators outputs to the combining circuit.


To test this unit, I fed the output to my SDR and used spectrum analyser software to check both for harmonics and intermodulation. However, the recommended maximum input to the RSP1A is 0 dBm (or up to 10 for short periods) and the output could have been too high so I built an attenuator and, as I would need an adjustable one for some other tests at some stage, I used a design with eight slide switches to allow setting from 1 to 81 dB. 

The circuit is similar to one found in the ARRL Handbook (a quick search of the net found https://www.arrl.org/files/file/Technology/tis/info/pdf/September1982_Attenuator.pdf). Here are some photos of it:


The table below might help you understand harmonics and intermodulation and mixing of two frequencies. (mixing is a special case of intermodulation). 

Assume each frequency generates harmonics, so f1, 2*f1, 3*f1, 4*f1 etc come out - known as the fundamental, the second harmonic, the third harmonic and the 4th harmonic. Repeat for f2. 

Now simply add each term in the first series to each term in the second series. Repeat using subtraction between the same terms. You quickly generate a lot of frequencies!

Luckily the strength of these gets less as the harmonic number goes up. Also, quite often the frequency is too far away to matter too much. 

Usually we focus on the second or third harmonic and the third order intermodulation, ie (2*f1–f2) and (2*f2-f1). Marked in red in the second table below. This is because they are close to the original frequencies f1 and f2. In a receiver, they might well be close enough to be passed through to the loudspeaker and be an interfering signal.


Incredible to think you get 60 different frequencies for just two tones generating up to the sixth harmonic, you sometimes need to consider higher, Bill Meara (of Soldersmoke.com) had to filter out an 8th harmonic lately as it was interfering with an oscillator. These frequencies can be computed by spreadsheet, which I have done for my two tones. The spreadsheet is on my blog.


In the table above note that the 3rd order IMD terms are at 13.021 MHz and 13.063 MHz. The 5th order terms are at 13.077 and 13.007 MHz. The other higher terms that are near the two tones are below the Spectrum Analyser noise floor so I need only worry about the 3rd and 5th. I need to add a bit of attenuation as I am slightly overdriving the SDR – the manufacturer says it can take 10 dBm for short periods and 0 dBm continuously – my tests show it is more linear if only driven by signals less than -10 dBm. An interesting feature of IMD is that if you drop or increase the fundamental signals, the 3rd


If I now insert 10 dB attenuation, the 5th order terms disappear and the third order terms are just under 60 dB below the fundamental tone. They have dropped 20 dB despite the fundamental dropping 10. This is evidence that it is the SDR that is generating some of this IMD – if it was all originating in the two-tone oscillator then everything would just drop 10 dB through the attenuator.

But increasing the attenuation by another 2 dB does not cause the 3rd order to drop 6 dB, so at this stage we are seeing the distortion in the two-tone oscillator itself. We need to keep the input below -10 dB and live with an IMD that is 60 dB below one tone or build a better shielded two tone oscillator and a better combiner (might have been better to put it in its own metal box…)


The fact that the 3rd order did not drop much further with additional attenuation indicates we are actually looking at the distortion of the two-tone generator. SDR third order IMD should drop 3 times faster than the amount the tones are dropping, and as the attenuator is after the tone generator and before the SDR then we are not looking at the IMD of the SDR, once the input gets below -10 dB.


In summary, this low cost test equipment will do the job – provided we work within its capabilities and doublecheck what we are measuring. Attenuators are vital, even the 0 dBm output of a NanoVNA needs to be attenuated to avoid overloading amplifiers and many circuits to be tested. 

By next month I will have tested a three transistor termination insensitive amplifier and a diode double balanced mixer (DDBM). The uBitx uses three of the TIA amps and a pair of DDBMs. 

The earlier articles described using a NanoVNA to test filters and I will apply them to three filters. That will be most of the receiver section tested.

You don’t need to test everything to build a uBitx but I want to
   (a) build a complete uBitx as it was originally designed and 
   (b) start substituting different modules to see if I can improve performance. 
Part of the fun of homebrew!

uBits is described at http://hfsignals.com and the Bitx20 groups.io website (https://groups.io/g/BITX20 ), also see http://ubitx.net/


26 - Making Filters using LTspice and a Soldering Iron

Making Filters using LTspice and a Soldering Iron

The Zoom talk I gave to the club at our December 2021 meeting covered a number of points – I have placed the PowerPoint on my blog at https://mi5afl.blogspot.com but thought I might summarize the material here.

One of the filters in the uBitx transceiver is shown below drawn using the simple LTspice tool.


Of course to simulate this we must add a 50 Ohm output impedance and a voltage source with an internal impedance of 50 Ohms. We must also add lines of text beginning with a “dot” to instruct LTspice what to do when the simulation runs. There are half a dozen types of spice command but the two below tell LTspice to do an AC analysis by sweeping from 1 to 30 MHz, 101 points per decade and to prepare two port network parameters such as S21, Zin and Zout. S21 is the “gain” of the filter in dB – it’s what a NanoVNA would show if it was measuring a real filter.


Hitting the “run” icon in LTspice produces a blank white window, right-clicking in it allows you to “add a trace” and you can select S21 (or Zin or Zout). Note you can remove phase information by right-clicking on the right hand axis and you can change the format of the Zin trace to linear by clicking on the left hand axis in the Z plot.


The performance of this filter is quite good for its gain characteristic – it passes 40m (7 MHz to 7.2 MHz) signals nicely and attenuates 14 MHz to -65dB. However, its impedance matching is not great, varying from 65 to 110 Ohms. So, if the design you have picked up from the web or a book is poor how do you design your own?

The ARRL and RSGB handbooks have tables of filters at 1 Ohm input and output impedances and frequencies of 0.159 Hz (this is one radian/second). These are not real filters of course – you scale up the impedance and frequencies to what you need. Not difficult if you follow the instructions but it is tedious.

As well as several downloadable pieces of software (ELSIE or AADE for example) there is a very good online filter designer at https://rf-tools.com/lc-filter/

You fill in the response of the filter you want – bandpass, highpass or lowpass.

You tell it what type;

Butterworth, smooth but gentle sloped.

Chebyshev has a good steep slope but has inband ripple – you specify how much, even 1dB is hardly noticeable. The remaining types are Elliptical (Cauer) and Bessel. Bessel is best for digital signals and Cauer is the steepest but has big ripples in the stop band. Chebyshev 1dB ripple is commonly used.


http://Toroids.info - can both design Toroids and Matching Networks


So once the simulations are done you can build the filter, the next question is how do you make the inductors?

Inductors can be easily made on Powdered Iron toroids – these have a name like T50-2 this is a toroid of 0.5 inch outer diameter and type -2 powdered iron painted a yellow colour. You should not use ferrite toroids (these have a FT prefix like FT50-43) although you can use them for wideband transformers, Baluns and chokes. To work out how many turns to use in your powdered iron inductor you can either take the square root of the desired inductance in nH divided by the Al constant for your chosen type (type 2 has an Al of 4.9) or you can use a handy online tool found at http://toroids.info/ The screen above shows that 13 to 14 turns are needed.

I wound the toroids for the uBitx filter (900nH inductances) and found I could get anywhere from 626 nH to 1000 nH by spreading out or compressing the windings on the core. I measured the inductance on my NanoVNA and dripped hot candlewax over the winding to keep them stable as I soldered them in. Hot glue would be a more permanent solution. Here is a photo of the completed filter.


I used polystyrene capacitors because I have a lot of them, 160V and 2.5% they are a good choice but can be hard to get hold of and are expensive. Ceramic discs or dipped mica are more stable and good high voltage ratings. So how did the real filter compare to the simulations? When I measured with my nanoVNA the results were poor, but it turns out there is something wrong with my nanoVNA. Richard's NanoVNA gave good results. When I switched to using a signal generator and my SDRPlay SDR1a as a spectrum analyser I got results that matched the simulation almost exactly. I don’t have a tracking generator so the diagram below is several screenshots stitched together

So, in summary, don’t believe everything you see in books or on the web. Verify designs with LTspice. Filter design is easy using https://rf-tools.com/lc-filter/ and http://toroids.info/  Winding toroids is easy provided you measure and squeeze turns until you get the right value. Candle wax holds winding securely so you can solder them into a circuit without disturbing the windings. 


25 - Equipment Review: A first look RF Signal Frequency Counter

 Equipment Review: A first look

RF Signal Frequency Counter

0.1MHz to 2.4GHz as seen on EBAY! By Ian, MI5AFL


I do have a couple of frequency counters that are 30 years old that will read to 550MHz but need 10
seconds to read to one hertz accuracy. I found the unit above on Ebay, there are a lot of frequency
counters on Ebay! But some have only 6 digits or use an LCD. It can be difficult to be sure of the
actual function of these units as the English description is often Chinglish and a bit inscrutable. I
wanted to measure crystals to one hertz accuracy for some Crystal filters I am building and wanted a
second (or third!) way of checking parameters; I have to admit my NanoVNA doesn’t drift much
when measuring the frequency of crystals but I like to have 2 or 3 different ways of measuring
things. In any case at under a tenner including postage it was worth taking a chance to see if it would
work. I am pleased to report it works very well! I paid £7.62 for mine plus postage from the Seller
“Alimodule” but there are over 20 sellers offering what looks like an identical or nearly identical
module. I got an email saying it might take 40 days and not to report the seller to Ebay however it
arrived in 25 days.


The connections to the unit are not too difficult to work out – there are two identical 2 pin plugs
mounted on the board (in white in the first photograph) and two leads are supplied, each with red
and black wires. You need to know that the lead near the two metal capacitors is for DC power (9 to
15V@60 to 160mA I think) and the input is applied to the end with all the SMT components (right
hand side in the top photograph).


There are also two pushbutton switches on the front of the unit, marked with a sideways U and a solid triangle, these “SET” or “CHANGE” values. Finding out what these do took some searching on the web for a manual, I am glad to say I succeeded although blind experiment would have worked eventually. I can email the manual to any who want it.


The “user interface” allows for 6 functions;


A single depression and release of the SET button brings up the words IF000000. If you hit the CHANGE button, it repetitively alters the first digit, hitting SET moves to the next digit and hence you set an offset between measured and displayed frequency. A final SET moves to the next menu item.


If after hitting the first SET button, you then hit SET again you arrive at the second menu item immediately - the message changes to “IF N” or “IF U” with the CHANGE button toggling between these, you exit this mode by hitting SET again. This mode allows you to either subtract or add the offset. Useful to retrofit into a radio and get a read out of the received or transmitted frequency when the Radio’s VFO is above or below the desired frequency by the IF frequency – often 9MHz or so. I may eventually fit this unit into my BitX 40, my 80m Epiphyte or a RF50 6m SSB transceiver kit I built from Hands Electronics a long time ago, though I might go back to EBAY and get a 6 digit as the VFOs in these rigs are probably not that stable to need 1 Hz accuracy.


The third menu item sets the channel mode to “A”, “L” or “H” and this selects the measured frequency range to 0.1MHz to 60MHz (the “LOW” band) or 20MHz to 2.4GHz (the HIGH band). These bring in a pre-selector and affect resolution. The LOW band can display to 1 Hz resolution whereas the HIGH band can display to 64Hz accuracy. The display on my unit refreshes every second.


The manual I downloaded has a next menu item that allows setting a filter; “DF ON” or “DF OFF” is the message. Did not do much for me – but my test signals were clean. The next menu item was marked as “Move a bit to the right” in the manual and “] on” and “] Off” on the display. I believe this toggles my unit between 0.1 second and 1 second sample time, which makes the unit read to 10Hz or 1Hz resolution on the LOW band. There is a further menu item that sets the LED brightness between “L 1” and “L 8”, from an easy to read dim to an overly bright level 8 display (I left mine on “L 1”). Do note however that I came across a diagram on the net (in Russian!) that showed a further menu item to set more options on gate time so your purchase might be slightly different to mine.


Once you have set the menu items the mode is stored and remembered the next time you switch on. So you only have to configure the unit once, and it might just work out of the box.


I connected the unit up to a Marconi 2022 signal generator which I believe is stable and accurate and also to my old frequency counter (a GW GFC 8055G). I did have to experiment quite a bit to set the signal generator output level to get a stable reading on the Ebay unit. On the low band any value from 200mV to 500mV worked ok but not above or below this value. The manual said 60mV sensitivity on the LOW band which seems optimistic.


At 11,000,000 Hz output the unit displayed 11,000,013 Hz so is a bit high, there are a couple of presets on the board but so far I have left it alone – it will suffice for my needs because it is remarkably stable. Left overnight in an outside shack, albeit above my garage and well insulated, the display read 11,000,014 the next morning so I can declare it as being stable, if not quite calibrated. The specification in the manual mentions a 2.5ppm TCXO and mine seems much better than this. I applied a 1GHz signal and set the mode to H, it read correctly with occasional readings jumping up 64Hz. It stayed stable for the hour that I ran this test. Not bad for a tenner!


24 - Amateur Radio on the net

 Amateur Radio on the net


There are many good video and audio programmes on the internet about amateur radio. The amateurs who produce these do so mainly on a regular
basis, monthly or weekly, some only “post” on an intermittent schedule – when they have something new to share. You may find them an interesting way to keep up to date with our hobby. I list some of my favourites below and perhaps you can give them a try. Let us all know if you have other favourites.


ICQ Podcast. This is an audio podcast, produced by mainly UK amateurs, they
report the news each week and also have a “feature”. They have 357
episodes online at    www.icqpodcast.com/   but I use a podcast app on my
smartphone and listen on headphones when out walking or on Bluetooth
when driving the car.


The other podcasts I am fond of are:
Ham radio crash course at http://hamradiocrashcourse.com/ for the audio –
but they only have the last 15 or so there, better to subscribe to their podcast
using your phone. This podcast is run by Josh Nash KI6NAZ and his wife Leah.
They ramble on a bit and often stray away from ham radio topics but I find
them entertaining. Josh also produces videos on youtube, and has started
hosting Ham Nation as well as his own content at
www.youtube.com/user/hoshnasi (search youtube for “Ham radio Crash
course”) I rarely watch his videos.


Ham radio workbench
has good coverage of technical items as well as “non
expert” talks. Try www.hamradioworkbench.com/ their website is good too.


The Soldersmoke Podcast is mainly about homebrew and hosted by Bill
Meara and Pete Juliano. Bill is found of old valve sets and Pete is a most
prolific builder – approaching 60 SSB rigs! Bill also runs a daily blog at
http://soldersmoke.blogspot.com/ and there is a link there to listen to the
most recent podcast as well as links to older archives, again it is better to
subscribe to his podcasts using a podcast app on your phone or tablet. They
are roughly monthly and have produced 357 podcasts


The videos I often watch include:


Ham Nation. This has been going a long while and used to be available on
some streaming TVs. It is now produced by Josh Nash about every two weeks
within his own weekly YouTube videos. See the link above. Ham Nation has
several presenters (usually at least 4) and each does a slot; the original
presenter is Bob Heil who runs a company making microphones, headphones
and other useful audio equipment. Worth listening to. Other presenters
include Gordon West, Val and Amanda as well as Don. Each is worth
watching.


Amateurlogic TV Another American “show” on YouTube, best watched on
YouTube although their channel carries videos of “Ham College” and recently
“shorties”. I prefer the hour-long programmes that go out about once a
month. There is also an archive at www.amateurlogic.tv/downloads.htm but
try the YouTube first at www.youtube.com/user/gthomas or search YouTube
for “Amateurlogic” The two main hosts George and Tommy also have input
from Emile and Mike. They often cover good technical demos of various ham
radio related topics as well as reviews of gear and software.


DX Commander run by Callum, M0MCX, who owns the DX commander
company (superb DX Verticals). Callum gives out all the details on how to
make his products yourself cheaply or you can buy bits or assembled
antennas from him. A nice guy and a prolific producer, he uses and
demonstrates/teaches how to use the MMANA antenna analysis software
and you can really learn a lot about antennas by following his YouTube
channel and watching his back catalogue. Search YouTube for
DXCommander - since I wrote the article for CONTACT the original DXCommander has been taken down by youtube in March 2022 (so far without explanation) Callum has created a new channel DX.Commander (note the dot)


Waters Stanton presented by Waters & Stanton Ltd usually presented by
Peter himself and often covers making antennas and gear as well as
equipment reviews where they promote the products they sell. Try
www.youtube.com/user/watersstanton/videos

 
I should mention that Martin Lynch also produce videos, often covering what
they have for sale second hand. They are on YouTube at
www.youtube.com/user/MLandSshop

RSGB
(www.youtube.com/user/TheRSGB ) During lockdown they were quite
prolific about uploading videos, they also uploaded the presentations from
their 2020 convention. They have over 100 programmes to watch.
TX Factor (www.youtube.com/user/txfactorshows ) only occasional videos
uploaded (27 episodes) but these are professionally produced, the RSGB
sponsor them. They often report on what hams are doing throughout the UK.
They also review equipment.


As I own a SDRplay RSP1A software defined radio I subscribe to two YouTube
channels from SDRplay.


Charlie Morris www.youtube.com/c/CharlieMorrisZL2CTM/videos   his
homebrew methods are inspiring.


M0NTV Homebrewing - Nick is worth a listen too – search YouTube for the
channel.
 

And the list goes on, for example dip into the youtube channels below...
QRP Labs, Ashhar Farhan, W2AEW, W0QE, NA5Y as well as Andreas Spiess
 

As well as these regular channels some of the recent ham radio conventions
have put their content onto YouTube. I “attended” the QSOToday convention
last weekend and they have put most of their presentations online using
Vimeo which is a YouTube alternative. I paid $10 for the convention so their
content is not freely available. 

The GQRP club did put their content online so, if you couldn’t attend on the weekend, they ran their convention you can catch up afterwards. I am a member of GQRP (at £6 a year, you should be too!) but catch up on their 2020 convention at    www.youtube.com/c/GQRPClub/videos    You should also note their 2021
convention is coming up in early September if you want live presentations
with interesting Q&A sessions after each talk (the Q&A is not put up on
YouTube normally). Join up at    www.gqrp.com/index.htm  


That’s all for now, the other internet resource I use is at    https://groups.io/groups where I subscribe to gqrp, RSGBTechnical, BITX20, SDRPlayUsers, qrptech, nanovna-users, nodered-hamradio, ucx, winmor and SoftwareControlledHamRadio. So many toys and so little time...

23 - Equipment Review TFT GM328 Transistor Tester Diode LCR ESR meter


Equipment Review: A first look
TFT GM328 Transistor Tester Diode LCR ESR meter
PWM Square wave Generator


I was looking for a simple capacitance meter as a spare and to backup up what I already have (I like to have at least two of everything so I can compare results).  I found the unit above on Ebay and was amazed at what it could do. It is not particularly accurate in some situations, but any reading is better than no reading.  It does many things, probably none of them particularly well, but it is cheap and everyone should have one!

 I suppose every radio shack should have some test gear – a soldering iron and a couple of digital voltmeter for starters, an SWR meter and maybe a power meter for seconds. The unit above along with a nanoVNA would nearly complete a shack as long as you had a modern HF transceiver. 

Ebay has the unit above for sale from dozens of suppliers for between £10 and £14. Search on the rather unwieldy title above. The design has been around for a long time and I am unsure of its original heritage, maybe it was a
2011 Embedded Projects Journal article by Markus Frejek? If anyone knows, please let me know.


There are details on the website

 https://www.mikrocontroller.net/articles/AVR-Transistortester 

and the EEVBLOG website has a extensive forum discussing it at

https://www.eevblog.com/forum/testgear/$20-lcr-esr-transistor-checker-project/


Older versions had simple 2 line text LCD screens, the recent ones have colour TFT screens so make sure you buy one that looks like the photo above.I will summarize what it can do here, although to date I have just used it to measure a few things I do believe it is a Swiss army knife of component testing!
 

Features of the GM328A;
Versatile connections; by using a zero insertion socket, inserting components is eas y, pick the correct pitch, insert and push the lever down.it does not matter which connections you use, for resistors, capacitors and inductors just pick any
two two pins. If you plug in a diode or transistor it will work out what pin is which, this alone makes it a joy to use, it can identify which pin is the base, collector or emitter as well as telling you the polarity (NPN or PNP) and the gain, and the Vbe. And similarly for MOSFETs and so much more. 


There is even some SMT pads where you can hold SMT parts to test as well. Works best if you have three hands though. The unit can measure Resistance, Capacitance and Inductance. Capacitors over 20nF also have their ESR measured. NB discharge caps before connecting them. I inserted a 1mH choke the unit
measured 1.05mH and when inserting a 10uH it gave .01mH so the readings were ok.

I couldn’t measure the small capacitance of a crystal (3pF) but other capacitances over 25pF read correctly. I could add the crystal in parallel with a 25pF and got a reading of 28pF so that is one solution. Theoretically accurate to 1pF - useful.


I tried a couple of transistors and it gave the correct pinouts and believable Hfe(gain) and Vbe. A couple of diodes gave good readings too. It gave Vf as 529mV and 502mV at 12uA so I can use it for diode matching for ring mixers.
 

The other (untested) features stated in the manual are that it can measure Zener diodes and LEDs (zeners up to 4.5V only)
 

The unit can also accurately measure audio frequencies (up to 33kHz) and also generate frequencies up to 2MHz these are square waves though. You can also generate a PWM signal and vary the mark to space ratio, this is at a fixed frequency of around 7kHz – a pity this can’t be used to test RC servos.


The unit can also test digital sensors and remote control! You’d need to read the manual to do this. There is a 4 page manual available on the net but the mikrocontroller site had a 140 page manual that should allow rebuilding the firmware – they talk about capacitor measurements of under 100pF
to 0.01pF accuracy, time will tell if I can get that going. 

In the meantime, I recommend this product for a general purpose component tester.


Sunday 13 March 2022

22 - Desiging Crystal Filters

 Designing Crystal Filters
Filters are usually used to block out a band of frequencies, you can have low
pass, high pass and bandpass that do what their name suggests. You can also
design notch filters (band-stop) and all-pass filters. All pass filters are needed
because although we tend to fixate on the strength (amplitude) of signals of
different frequencies passing through our circuits; the output voltage versus
the input voltage, we should also consider the time delay of each frequency
as it passes through each part of our system. Such delays are inevitable in the
real world, expressed either as a phase delay or a time delay, we use the term
group delay to plot actual time delays against frequency. Non-linear group
delays can make audio signals sound strange, a harshness that is hard to
describe. This is a topic that deserves more attention in the RF (and audio)
world, it, and ringing, affect digital signals considerably, even RTTY and CW. It
will become more important and modern receivers may well have much
better audio than receivers of old. All pass filters add a different delay to
different frequencies without significantly weakening them. A future article
might look at how DSP can use all pass methods to improve and remove such
distortion. An advanced topic.


In the short term I want to make a complete SSB transceiver based on the
μBITX (https://www.hfsignals.com/ and https://groups.io/g/BITX20/topics ). I
enjoy homebrewing and will build it from scratch. Most radios have only four
types of circuit within them, amplifiers, mixers, filters and oscillators.
Oscillators are very conveniently available as Si5351A or Si570 modules driven
by an Arduino or ARM, the rest is straightforward provided a modular
approach is taken.


In this article I will concentrate on crystal band pass filters and end up using a
simple method with as simple tools as possible. I discussed last month how to
measure the parameters of a bunch of crystals and how a nanoVNA and
spreadsheet are good enough. In truth this is still work in progress, I still have
some concerns over potential inaccuracy in determining Rm and Co. There
are four or five ways of measuring these and I will continue to experiment
and although using a VNA is really convenient and “good enough” it may be
better to augment this with a capacitance meter or simple resistive test jig
(more in a future article or blog entry).

To recap, a crystal can be represented as three components in series: Rm, Cm
and Lm and a fourth component in parallel with these three; Co (other texts
sometimes call this Cp and the motional components are sometimes called
Rs, Cs and Ls). From these can be calculated the Q of the crystal. Better
described as the unloaded Q. 


In the old days we used a filter circuit called a Lattice type, it required crystals
to each have different frequencies, which was a real nuisance, expensive or
difficult to arrange. The more common modern filters are of a type called a
ladder filter and this is what I will discuss here. These are designed assuming
equal (or nearly equal) crystal frequencies. The process of designing filters
invariably assumes equal values for the four parameters of every crystal and
is most conveniently done with design software. Sometimes only two or three
parameters are used and then extra capacitance added to ‘tune’ the filter.
Some types of filters don’t need this and I favour simplicity over performance
– if you are only building one transceiver you can afford the luxury of
revisiting the design and fiddling with it once it is working; the beauty of
homebrew! So here is the ‘Mark 1’ filter. 


Instead of design software you can use tables of coefficients to multiply and
scale components to suit any desired frequency, bandwidth and terminating
impedances, it can be hard work though and modern software packages
make crystal filter design very easy. 


Although you don’t need all the parameters, you do need to preselect your
crystals to be as close as possible to each other in frequency, ideally within
2% of the bandwidth of your chosen filter – to design an SSB 2.2 kHz filter
requires crystals to be within 44 Hz. To design a 350 Hz filter for CW requires
(ideally) crystals to be within 7 Hz! older texts stated getting within 5 to 10%
‘will do’ often producing in-band ripple which is not necessarily noticed when
reading CW at a single frequency.


There are a number of software packages available free; such as the AADE
software (http://www.ke5fx.com/aadeflt.htm ) which is now free but didn’t
used to be. The Elsie design package is paid for but has a free limited version
(http://tonnesoftware.com/ ). If you have bought the book by Wes Hayward
‘Experimental Methods in RF Design’ then it comes with a software suite that
includes LADPAC and XLAD as well as XTUNE and others. Every homebrewer
should own a copy of “EMRFD”. The ARRL handbook (another invaluable buy)
often comes with a CD with design software but here I will use a software
program known as Dishal but you should experiment with the others to see
which suits you.

I will be using Dishal version 2.0.5.2, You can get it from
http://WARC.org.uk under the technical tag or google to find it.
To experiment does not mean spending money buying crystals and hours
soldering up circuits; use simulation. The LTSpice simulation software from
Analog Devices (https://www.analog.com/en/design-center/design-tools-
and-calculators/ltspice-simulator.html ) allows drawing a circuit (schematic in
US English) comprised of crystals and capacitors (and other things as needed).
Note that the XTAL symbol in in the ‘Misc’ library folder and you set the
crystal parameters by right-clicking on the symbol, the first parameter is Cm
and the series inductance and resistance are Lm and Rm whereas the parallel
capacitance is Co.

You must apply a voltage source of known internal impedance that can sweep a range of frequencies – e.g. 5 kHz either side of the filter’s bandwidth and delivering the output into a load impedance where the output voltage (and phase) can be captured and plotted against frequency. You must adhere to a filter’s designed input and output impedance if you are to get the correct, designed, response. 

Applying filters in the real world will inevitably require matching circuits at the input and output as it is too difficult to design filters with standard 50Ω inputs and outputs. A simple ferrite toroid transformer at the input and a capacitor to
ground may do or a matching network can be designed by using an online
calculator that can also design the toroids e.g. at http://toroids.info.


A few notes about Filter types: not all software covers all types, I list a lot of
them here but it is convenient to use QER types in homebrew as they are
simplest, they are a recent development – I can find no reference to them
prior to 2010 and older textbooks do not cover them. Commercial filters are
often 0.1 dB ripple Chebyshev types, as least for SSB, FM and AM use. They
do not do well passing narrow band digital signals where Bessel types are
best at reducing bit errors.


The criteria to use when choosing a filter type include; convenience and
cheapness (of course!) but also the desired bandwidth, the insertion loss, the
steepness of the side slopes, the amount of in-band ripple, the input and
output termination impedances and how these change with frequency (i.e.
the return loss (SWR) across the full frequency spectrum). The group delay i.e.
the linearity of the time delay versus frequency is often ignored but affects
ringing and how well audio sounds as well as how many bit errors digital data
will create.


Butterworth type: This has a smooth response in the passband with no
ripples but the side slopes not as sharp as some other types. They need
capacitors of varying values (in pairs as the schematic is symmetrical), ideally
you need to add some series capacitors to the centre crystals or pick crystals
at very slightly different frequencies to the ones at the beginning and ends of
the filter. This is true of the Chebyshev types too. Butterworth have lower
insertion loss than Chebyshev types.


Chebyshev type 1: have sharp slopes but have ripple in the passband, you
have to choose how many dB the ripples should be when you do your design.
You won’t notice 0.1dB. Insertion loss increases with order (the number of
crystals) and with higher ripple. Technically there are two types of Chebyshev
but we normally use type 1 (type 2s have ripples in the stop band)


Elliptical type also known as a Cauer: have ripples in the passband as well as
very large ripples in the stopband – you can often use this to advantage if
designing LC low pass filters – the first trough in the stopband can be made to
coincide with the second harmonic of the pass frequency giving really good
harmonic suppression. This is not that relevant to narrow passband filters.


Bessel type: Good constant group delay characteristics, average filter slope
and passband ripple with lowest insertion losses, good for CW or data. Linear
Phase types are similar, with slightly higher insertion loss but a better shape
factor (steeper sides). The Gaussian types: have better shape factors than
either the Bessel or linear phase but slightly worse group delay. You typically
choose what is called Gaussian to 12 dB or Gaussian to 6 dB or just a
Gaussian type. These are all good for CW or data. They are hard to interface
to as their return loss varies a lot.


Cohn Min-Loss type : These have in band ripple but all the capacitors have
the same value, the QER is better. The ripple in the passband increases a lot
with increasing order and below 500 Hz width 6 order they ring a lot
QER type have the major advantage that all its capacitors have the same
value like the Cohn but there is less ripple in the passband. This is at the
expense of needing an extra couple of crystals that do not increase the order
of the filter. Its insertion loss is less than the Cohn too. Good for SSB.

I will concentrate on the QER type as it is the simplest and has reasonable
performance. It is even possible to make QER filters with no mathematics and
no software, just by experimenting. It is very difficult to make the other types
this way as they have too many interrelated components. The blog of W3JDR
describes how in his July 2017 entry
(https://w3jdr.wordpress.com/2017/07/31/qer-crystal-filter-designer) but it
is easier to use the Dishal software or the table/equation method.


This schematic above shows an 8th order filter, you don’t count X1 or X10
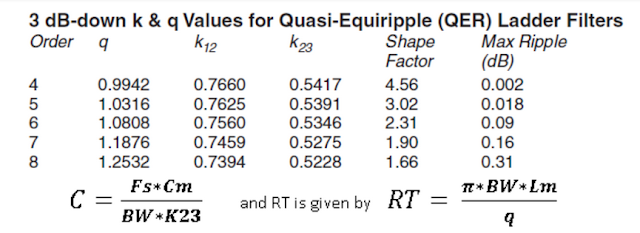
The table below lists q and k coefficients and applying these to the equations
for C and Rt is straightforward to calculate, they ignore the parallel
capacitance Co of the crystal and the series resistance Rm but they are a good
starting point.


Alternatively, it is much easier to use the DISHAL Software as it has an option
to design QER components that appears to correct for Cp (commonly called
Co) the screenshot below shows the form you fill in after running DISHAL, the
screenshot is from version 2.0.5.2 click on the QER menu item on the top line
after running DISHAL.


 As you see, you supply Lm and Cp, tell it what frequency your crystals are and
what bandwidth and order you want. It tells you to use 49.3pF capacitors and
that the input and output impedances are 252.8 Ohms. The frequency will be
slightly off too. The next stage is either to build it or to simulate it. We can
then change the components to 50pF and 250 Ohm Zin/Zou and see what the
filter response looks like. An advanced topic is to simulate the filter with
actual parameter values for each crystal and not just assume that all crystals
are absolutely identical. You can move your crystals around and pick the best
arrangement before building. This is a new idea I have not seen before. This
still needs further work as I think the NanoVNA is not reporting the Rm value
accurately enough although its frequencies are stable.


My QER Filter
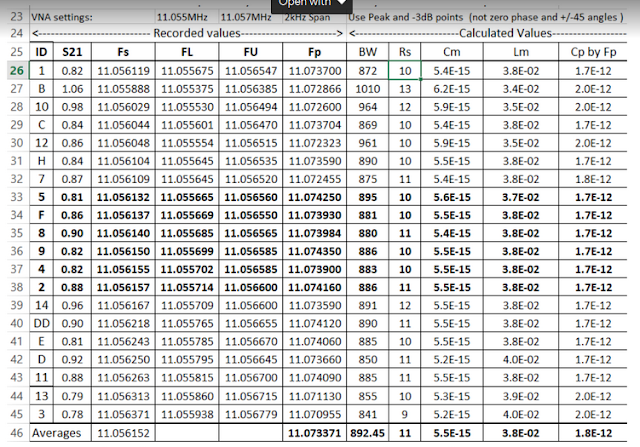
I have a batch of 20 crystals and want to make a 6 pole QER filter. I have
measured these using my NanoVNA as described in last month’s article. Here
is the relevant section from the spreadsheet stored on my blog
http://mi5afl.blogspot.com/p/blog-page_15.html. The file is called
‘Calculating_XTAL_Parameters_with_a_VNA.xlsx’. 


I also measured Co by a capacitance meter and got values around 3.3 pF, not
sure which is the correct value – measuring small values of picofarads is
difficult! Also, I should have recorded S21 more carefully, three significant
figures and I need to recheck the figures - I have actually ordered a new
nanoVNA (a V2 to allow antenna analysis at 2.4 GHz to allow me to make WiFi
helixes!) and am making up the G3UUR crystal jig to allow comparisons.
I picked the values in bold as they are all within 15 Hz of each other, then
created a schematic in LTSpice, initially using the average values to confirm
the Dishal design.

Note to use LTspice for verifying crystal filters you need to use the XTAL
symbol found in the ‘misc’ library when you select the ‘insert component’
option. Also, you do not enter a frequency value for the xtals – you enter the
series inductance and capacitance values Lm and Cm and the resonant
frequency is calculated for you. In fact you should enter values for Rm (known
as Rser) and Cp (LTSpice calls this Cpar and some texts use Co).


Place the XTAL symbol on the
schematic and right click on it
and you should see the left-hand
window; Note the units of
‘femtofarads’ for Cm.
You may also want to have these values visible on the schematic.
To do this hold down the control key and click on the XTAL symbol,
the window below for the “Component Attribute Editor” should appear.
Move the cursor to the Vis. Attribute and right click to place an ‘X’ in the appropriate cell.


Once you have the schematic as shown you can run the simulation, click on
‘out’ to get the filter response. You may need to do some maths to get an exact filter loss in dB so watch out that you read off the correct input and output voltages. Note the bandwidth below is actually 1.76 kHz bandwidth and the shape factor near 2, which is a good narrow SSB filter that suits my ears, some people prefer 2.2 kHz widths...

When I add LC matching and put in actual measured parameters for each
crystal and standard component values for the capacitors, I have the
schematic below;

And this gives a response with similar bandwidths – 1.85 kHz.

In summary, you can use the DISHAL software to quickly design filters, you
can use LTspice to verify the filter response and you can alter the LTspice
schematic components to experiment without having to build many versions
of a filter.


References and bibliography:
The ARRL Handbook 2015. The two pages of section 11.6.2 ‘Crystal filter
Design’ (and all of chapter 11!)


Experimental Methods in Rf Design by Wes Hayward W7KOI, Rick Campbell,
KK7B and Bob Larkin, W7PUA. The 8 pages of section 3.4 ‘Crystal Filters’ Page
3.17 onwards


Horst Steder, DJ6EV and Jack A. Hardcastle, G3JIR, ‘Crystal Ladder Filters for
All’, QEX Nov/Dec 2009, P14-


Dave Gordan-Smith, G3UUR ‘Further Thoughts on Crystal Ladder Filter
Design’, The QRP Quarterly, Spring 2010.

Randy Evans, KJ6PO, ‘Crystal Parameter Measurement and Ladder Crystal-
Filter Design’, QEX, Sept/Oct 2003, P38-

J. A. Hardcastle, G3JIR, ‘Ladder Crystal Filter Design’, QST November 1980
Wes Hayward, W7ZOI, ‘A Unified Approach to the Design of Crystal Ladder
Filters’, QST May 1982, P21-

Wes Hayward, W7ZOI, ‘Designing and Building Simple Crystal Filters’, QST July
1987, P24-


Bill Carver, K6OLG, ‘High Performance Crystal Filter Design’, Communications
Quarterly Jan 1993, P11-


Wes Hayward, W7ZOI, ‘Refinements in Crystal Ladder Filter Design’, QEX,
June, 1995. P16-

Saturday 12 March 2022

21 - Crystals - Measuring Crystal Parameters with a NanoVNA

Crystals
 Crystals are made by clamping a piece of crystal between two metal plates, this resonates in at least two ways. As frequency increases there is a peak in response and then as the frequency increases further there is at least one dip in response. We describe these as the series resonant frequency, Fs and the parallel resonant frequency, Fp. There are other, smaller, peaks and troughs above these fundamental modes of operation. Below is my NanoVNA screen showing S21 – the “thru gain” in dB.


We can draw an electronic circuit of coils, capacitors and resistors that behaves in the same way. This model only partially relates to the real physical device but it is very useful nonetheless. Usually we use a series LCR circuit and in parallel with this, a much larger capacitance (which relates to the metal plates used in the crystal). Thus we have Lm, Cm and Rm in series - called the motional components and then Co in parallel with them.  


To recap how LC circuits work (and since coils always have resistance this applies to RLC circuits too). A series LC circuit has lots of Ohms at low frequencies due to the capacitor, the capacitive reactance decreases as frequency increases. We also have lots of Ohms at high frequencies due to the coil, the inductive reactance gets bigger as frequency increase. They cancel at resonance when they have the same numeric value because they are 180 degrees out of phase. Hence more signal gets through at resonance and the CH0 -> CH1 LogMag Thru measurement (S21) shows a peak - minimum attenuation. There is some attenuation but it is solely due to Rm being in circuit. Parallel LC are the opposite – they block signals at resonance. The parallel combination of Co (diminished slightly by the much smaller Cm) with Lm is what gives the first trough at Fp. 


Co is several hundred times bigger than Cm - some design software uses a fixed ratio of 220:1 but Co is easy to measure with a capacitance meter in the 3 to 5 pico-Farard region. Grounding the metal case (which you should always do) adds another picofarad to Co - this can be modelled as two capacitances to ground of about 0.5 pF each.


Typical values for Cm are one to two hundredths of a picofarad and this is too small to be measured directly. Lm is a number of mH and Rm is 5 to 20 Ohms or higher. These values are for typical crystals used at HF frequencies (5 to 20MHz). The usual strategy to finding Cm is to find Lm and then use the formula for resonance at Fs. 


Finding Lm usually involves finding the Q of the crystal at this first peak, since Q is defined Fs/BW where BW is the bandwidth where the response is 3dB below the peak (also near where the phase shift is +/-45 degrees  - it is close to zero degrees at resonance) Also Q is related to Lm and Rm - it is actually the reactance of Lm divided by Rs so if you know Rs, Fs and the bandwidth you can work out Lm. The formulae are slightly more complicated as you need to take into account the source and load internal impedances (50 Ohms) but the theory is sound. You do not need to remember any formulae as a spreadsheet can do all the calculations for you. 


My first measurements were made on low cost crystals designed for use in digital circuits (Microprocessor clocks) and I found them to have very high Rm values - this corresponds to poor quality (low Q) devices that would make RF crystal filters with high insertion losses. There are Crystals and there are Crystals so be careful - they all look the same!
Uses of crystals
Radio amateur homebrewers make crystal filters and oscillators themselves. To make a filter requires that you know at least some of the parameters. You definitely need to know the series resonant frequency Fs. The design method for modern filters need the crystals to be very near or at the same frequency - if you need 8 crystals in your filter, you need to buy 25 or 20 crystals and go through them to find 8 that are a good match. Unless you are rich enough to order matched sets. A rule of thumb for an SSB filter is to pick frequencies all within 2% of your desired bandwidth. If you can’t then there will be more ripple in your passband - barely audible.  You can "pull" a crystals frequency by adding a series capacitor or a series inductor. This degrades the frequency stability and is a bit of a faff when building filters.


How to measure these parameters Lm, Cm, Rm and Co ?
There are 4 or 5 competing ways and several authors have attempted to compare them to see which is "best" or more accurate. Study the references for more details. Frankly I like the idiom "Perfect is the enemy of good enough" and here I just use the NanoVNA but do note that it can also be done with a couple of test jigs containing a few tens of pence of components and simple test gear such as a DVM and a receiver, an accurate frequency meter helps (£8 on Ebay?) A super stable, accurate signal generator is handy but you can make one using one of your crystals.
But if all you have is a NanoVNA you can measure all you need. It is more accurate to use your VNA with the jig below to transform the 50 Ohm output and input impedances of the VNA to 12.5 Ohms, but again it is not needed for amateur filters, particularly since the VNA can test a completed filter and you can use LTSpice to correct the model (or just fiddle with the results) - you are only building one filter, not a thousand so experimenting (fiddling) is practical.


The second arrangement is good enough to make amateur filters with.
At Fs resonance Cm and Lm's reactances cancel and you are left with Rm dominating the flow of current - the NanoVNA can report on on attenuation of a few to 10s of dB in its S21 reading (CH1 LogMag). Good crystals drop 1 to 2 dB poor crystals, 4 or 5 dB,


Where S21 is the CH1 LogMax dB reading at Fs (as a positive number), the reading is probably correct within an Ohm.
If you measure the width of the Fs resonance you can measure the Q of the circuit. Defining the width as the -3dB points either side of the peak gives us the Bandwidth BW and Q = Fs/BW. Since Q is also XLm / Rm then we can work out Lm. In practice the formulae take into account the 50 Ohms in the source and destination
devices and hence we have slightly more complicated calculations to do. Since a spreadsheet or software works this out, all you have to do is make 5 measurements to get all the parameters that define the Crystal; Fs, FL and FU as well as the attenuation at Fs and the frequency at Fp.


To take readings accurately you would need to adjust the span to be 2 to 4 kHz wide around Fs and then again around Fp – you should calibrate the VNA every time you change settings on the VNA. Alternatively use the PC software NanoVNASaver and use multiple segments, Calibrate the VNA itself for the max and min settings on the PC screen but tell the PC software to do multiple sweeps (known as segments in the NanoVNASaver software) the PC screen below has 8 segments and this gives resolution to 2 Hz approximately. 


The markers above show the -3dB points of Fs. From which we get Bandwidth BW and then the formula below gives Cm taking into account the 50 Ohms in the output and input circuitry of the VNA


Moving to the first trough on the VNA screen, this is due to the parallel circuit of Lm and Co  - actually Co is in series with Cm but Cm is hundreds of times smaller than Co, our formula can correct for this (some texts don't bother, but as we use a spreadsheet to all our calculations we can let it do the heavy lifting.)
To calculate Co we use the formula below and use the difference in frequency between Fs and Fp as well as the absolute value of Fp. Make sure you are seeing the first trough - some crystals have spurious troughs at higher frequencies (not just the harmonics)
And that's it, we have Co, Rm, Lm and Cm. I will place my spreadsheet on my blog ( at http://mi5afl.blogspot.com/p/blog-page_15.html to automate the calculations - below is a screenshot


Note real circuits have a capacitance to ground as well as Co -particularly if the Crystal metal case is soldered to ground (which is a good idea) so a better equivalent circuit adds two new small capacitors - of about 0.5 to 1 pF each. We use this after designing the filter using filter design software. These usually assume the same (average) parameters for every crystal, we can improve on the design by putting the circuit into LTSpice and editing the parameters and plotting the response and changing capacitor values or crystals until happy with the plot. Using LTSpice is much easier than soldering!


What if you don't have a NanoVNA?
1. Signal Generator Method (also needs DVM or Oscilloscope)
With a good signal generator and a voltmeter with a few diodes and resistors you can measure most of the parameters. Using a diode detector will allow the DVM to give a representation of voltage output through the crystal. You can sweep the signal generator to find Fs. Do this with a 3dB attenuator pad in circuit (3 resistors). Note the reading, remove the pad and sweep both up and down from Fs until you get the same voltage - this gives the -3dB points and hence the bandwidth BW.
To measure Rm, apply Fs and note the reading, remove the crystal and insert a variable resistor - 100 Ohm but not a wire wound!. Adjust the variable resistor until you get the same voltage reading, remove the resistor and measure its value on the Ohm-meter setting of your DVM.
Applying the formulae above for Q will give Lm and the formula for resonance will give Cm. You can use the parallel resonance to estimate Co or just assume it is 220 times bigger than Cm (assumes big HC49 Crystal cases - use a smaller estimate for the low profile HC49 or SMT parts – e.g a factor of 170 ). You may need a frequency meter if you can't trust your signal generator settings. The generator still needs to stay stable in frequency and output throughout all your measurements and you minimise your handling of the crystals (to keep their temperature stable). You can make your own generator using one of your crystals and a circuit where you "pull" the output to either side of Fs. Assuming you have spare crystals. You can buy a frequency meter from Ebay for £8!
2. The G8UUR Method (needs Frequency Counter)
This puts the crystal in a small test jig where it oscillates - this gives Fs. You add a known capacitor in series with the crystal and note how much the frequency moves from Fs. G8UUR worked out formulae to give Lm and Cm. You have to guess Rm and Co unless you use other jigs


Thursday 10 March 2022

20 - A Cheap Homebrew 2m Antenna


A Cheap Homebrew 2m Antenna

A simple 2m antenna can be made out of antenna twin feeder. The antenna has good gain and is easy to make. It does need to be erected away from metal things and needs a simple choke at its base – easily made of 4 turns of coax 6 inches in diameter a few inches (4”-5” max) from the attachment point of the coax to the antenna . The details vary a bit depending what type of twin feeder you have, there are two common types – slotted 450 Ohm Black feeder and 300 Ohm solid clear plastic feeder sometimes used for old TV antennas. I will use this 300 Ohm TV feeder as I have stacks of it (RS used to sell it). If you want some of it just ask.

450 Ohm Slotted feeder to a homemade HF dipole          Clear 300 Ohm TV feedline being prepared.

The aerial below is known as a Slim Jim. Wikipedia says G2BCX. Fred Judd designed it in 1978. The ‘J’ in the name is because it is related to a J-Pole, it’s a folded dipole version of it. Otherwise I suppose it would be called a Slim Fred. The layout has three main characteristics. It is a folded dipole half-wave vertical (an end fed half wave) fed by a quarter wave of feedline (the bottom third of what you build) which acts as a transmission line transformer, finally there is a tap on the transmission line to match the 300 Ohms of the feedline to the 50 Ohms of the coax. Quite a lot going on but we can ignore the theory and just build it. 

Also as usual, the theory is wrong in real life. You must experiment a bit with every antenna, my cable was sold by RS, other cables may behave differently. I needed 61 inches despite the theory saying much less (53” taking my measured VF into account) It has the gain of a dipole, despite what some manufacturers say.

In Imperial units you need only remember that it is 58 to 61 Inches long, with top and bottom shorted. There is a one inch gap that starts 19 inches up one side and the coax is attached roughly 4 inches up from the bottom with the shield of the coax going to the side with the gap in it.

You might need to move the coax feed point plus or minus half an inch to get a good SWR. At 58 inches long my best SWR was 2.2 to 1 at 145.125MHz with the antenna hanging in free space (3 or 4 feet away from the walls in my shack. At 61 inches long I get 1.12 to 1 with the feedpoint at exactly 4 inches. 

Keep your SWR ideally below 1.5, although 2 to 1 will work ok. The SWR will change when you hang it up, or stick it in a plastic pipe. Some report a 5% drop in frequency inside a PVC pipe. I think the overall length is more important than the feedpoint – the lack of a pronounced resonance – and more importantly the lack of symmetry about resonance are indications of common mode current – flowing down the outside of the coax, the turns of coax are not doing a very good job, they are better than nothing and they will get you on the air

Some turns of Coax are vital – otherwise you get RF in the shack and your SWR meter will “go strange”, your lips will tingle when you kiss your microphone, don’t kiss your microphone. NB, my feeder needs 61 inches, despite my measuring its velocity factor as 0.86. I need to do further research to check my measurements.

There are several Slim Jim Calculators online – they give lengths to two decimal places, you can type in a desired 2m Frequency, and get super accurate calculated values… that will be wrong. 

Inevitably you need to experiment and adjust if you want a really good SWR.


Here are some graphs of performance, note this is still work in progress, Note that taping the antenna to a small (15x10mm) piece of wood affected the SWR, note that inserting this wood and antenna up a wide PVC pipe affected the SWR and pushing the antenna alone up a narrow PVC pipe affected the SWR.

I will experiment further and put final construction details on my blog at https://MI5AFL.blogspot.com. Finally I am happy to give anyone some ribbon cable and a length of coax if you want to make your own. Email me at MI5AFL@arrl.net if interested.