LTspice
is a free software package that can compute and display what the
output of a circuit would be if we were to build it and apply some
inputs. We call this process simulation; this can be very useful –
it is a lot faster to draw a circuit then to build it. I have been
using it for years and am currently working on simple transistor
circuits and building up to simulating an entire HF transceiver (the
uBITx) before building it. The text below makes more sense if you
download and try the software.
To get you started I will show you how to use LTspice to see the performance of a simple low pass filter. I will first apply a range of frequencies and then show you the frequency response. Here is the circuit of the filter (also called a “schematic diagram” in American English)
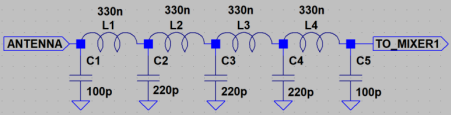
To simulate this we must add a voltage source – at the antenna inputs. The voltage source should be given a series impedance (Rser) of 50 Ohms. We also need to add a 50 Ohm load to the output. Filters only work correctly if they are properly terminated with their designated input and output impedances. Rightclick on the voltage source and set Rser to 50 and the AC amplitude to 1 Volt. Don’t give it any of the functions you see on the left of the form. (keep it at the default of “none”)
In Ltspice you add a voltage source using the “add component” icon on the tool bar. The coils, capacitors and resistors are added by the obvious icons. You add labels and wires as shown and assign values by rightclicking on the components. To run the simulation below you select a “running man” icon on the toolbar. In addition you must specify a simulation command – this is done by planting text on the schematic that begins with a dot - such as .AC dec 101 3Meg 45Meg You can do this by picking “edit simulation command” on the top line View menu item – it allows you to fill in a form that explains that this command causes a linear sweep from 3MHz to 45MHz with 101 points per decade. The .AC analysis is known as a small signal analysis it is only an approximate result but it does allow looking at a range of frequencies – the other often used command is the .TRAN – a super accurate analysis but only at one frequency. For a filter we want to sweep the input frequency.

Select run by clicking on the running man symbol at the top, or right-clicking the mouse
After running the simulation a blank, black window appears – the plot pane (I changed mine to white to save ink here!). To add a trace to this simply let your mouse hover over the output label on the schematic “TO_MIXER1” and notice that a symbol of a voltage probe appears, left click and you get the waveform below.

You can add cursors by double clicking on the green label at the top and move the cursors to see the insertion loss and -3dB points. This is useful but LTspice can do so much more. You can use LTspice in, maybe 8 or 9 different ways to work out input and output impedances, noise and distortion measurements as well as just the frequency response.
Just running LTspice once is fine but LTspice is much more useful than that. Say the filter was to be made with components that had a 5% tolerance. LTspice can “run” a circuit tens of thousands of times and change the component values each time – randomly plus or minus 5% on each component. After all these runs you can see if the performance is good across all the runs. If not then you should be using 2% components.
To do this is a very advanced use of LTspice. Instead of giving a capacitor a value of 100p you give it a value or formula denoted by a name enclosed in curly brackets { } then somewhere else in your circuit you define a range of values that it should take. I wanted the system to pick random values for me using a standard distribution also known as a Gaussian distribution, there is a GAUSS function available. Here is the modified schematic. Check the helpfiles for what .PARAM and .STEP do.

I told LTspice to do this 5000 times – see the .STEP command above and in the help files. The 5000 runs took 15 minutes on a fast laptop. I have run jobs overnight, early in my professional career I once ran a simulation that took 26 days to get an answer. (glad it wasn’t 42) The plot below is after 50 runs. One of the runs has a 2dB discrepancy and would affect 30MHz. But it is mainly ok.

Looks like a reasonable filter, even if built with 5% capacitors and 10% inductors…
This is not a tutorial on how to use LTspice – just to show you it can be a useful tool. It is a simple tool to use and there are several good Youtube videos and blogs showing you this – a good start is; https://robs-blog.net/2017/02/10/lt-spice-for-radio-amateurs-part-1/ More advanced is the webpages of Gunthard Kraus at http://www.gunthard-kraus.de/ he also covers QUCs and microwave simulators. I have corresponded with him and he is a good guy. The youtube videos of “FesZ Electronics” are excellent but can be advanced. https://www.youtube.com/c/FesZElectronics/videos LTspice can be downloaded from https://www.analog.com/en/design-center/design-tools-and calculators/ltspice-simulator.html And there is most excellent support from https://groups.io/g/LTspice I hope to update my own blog soon on 8 lessons on using LTspice for transistor design for simple RF buffers check out http://mi5afl.blogspot.com/
Go and play … I mean experiment…
links aren't working - will try and fix, but for now copy the text (select and hist control-C) and paste with control-V into your browser url window (control-L brings it up)
ReplyDelete