


In the good old days we made Variable Frequency Oscillators (VFOs) by wiring up oscillators with valves, FETs or BJTs and hand-wound coils, bought and installed expensive variable capacitors and spent a long time ensuring mechanical rigidity, nice cosy stable temperatures and had much fiddling about to get good stability and the correct frequency range.
We often needed many VFOs within a multi-band transceiver, each was a trial...
Nowadays we have some rather nifty integrated circuits that can use one high stability crystal and magically produce any frequency you want; various multiplications and divisions take place inside the chip to get to the value you want, sometimes not totally the right value, but it hardly matters if the output is one hundredth of a hertz off frequency! Technically the output is a wee bit noisier than a pure, hand crafted oscillator but by gum it is a lot handier to "make"
There are a few chip families in common usage, the AD9850, the si570 and the si5351 for example. This latter chip is used in the uBitx although the si570 has less "noise" and the AD9850 produces a sine wave and not a square wave.
This is modern AD9852 module, it can be interfaced to by using either parallel or a serial connection. Older types (on ebay) are serial only, either is usable with an Arduino. It is a different technology to the next two modules/chips and its DDS generation gives a sinewave but also a number of low level spurs at various frequencies, a low pass filter can help here.
This is an example of the tiny Si570, it only has 8 connections and you can glue it upside down and tack 8 wires to the pads, or use a PCB. It has only one output but has less (phase) noise than the Si5351. It has a number of variants depending on the voltages of the interfacing signals, be careful which one you choose.
The blue PCB with rounded corners has a Si5351 mounted on it and the three outputs brought to pads that can take SMB connectors or soldered thin coax cable. Again a PLL type, three square wave outputs. It can be driven from either a 25 or 27MHz crystal and you need to know to let the software know.
The SI5351 is good enough, has three outputs, few pins to solder and very convenient - provided you can get the magic multiplication and division numbers inside it at power-up or as you tune across the bands. This means another chip - a simple microprocessor. The two communicate using either a couple of wires serially.
You do not need to be a "computer programmer" to construct a VFO module using these. You do not need to be a "mathematical genius" to work out the numbers to get a wanted frequency output. Many hands make light work and many hands have done the work for you.
For the uBitx you just download a file from the internet and then upload it into the microprocessor and it all just works. The uBitx and its earlier sibling the Bitx40 both use a module called a Raduino - it has a si5351, a nano Arduino and some sort of display, either a 2 line text based LCD or a graphic tft. There is usually a knob and switch or two to contend with in the complete user interface. Tune, set Volume, push to talk and some way of selecting a few things are all that is needed. You may want to implement a VFO A and a VFO B as well as memories both quick and banked, band switching and maybe RIT or IF shift functions, it's all just software...
For this particular bit of software it is fairly easy to understand in general what it is doing, if you don't get dragged into trying to understand the minutiae and not too difficult to change one or two lines to modify the code a bit. To more fully understand what is happening you need to study the 41 page datasheet and an 63 page application note available from the chip's manufacturer and since human written text is often ambiguous you would really need to physically experiment with the chip and have good test gear.
The application note is found at
https://www.skyworksinc.com/-/media/Skyworks/SL/documents/public/application-notes/AN619.pdf
and the datasheet at
https://www.skyworksinc.com/-/media/Skyworks/SL/documents/public/data-sheets/Si5351-B.pdf
Most people do not read the datasheet but do use the work of others - the secret to benefiting from the works of others is to use their libraries and program source code; there are several popular ones for the si5351; simple or powerful.
The Arduino web site has both the library from Adafruit (a company that sells Si5351 modules https://www.arduino.cc/reference/en/libraries/adafruit-si5351-library/ and the work of Jason Milldrum at https://www.arduino.cc/reference/en/libraries/etherkit-si5351/ These store the code on a site called github which is used by many programmers. Searching github finds the work of Pavel at https://github.com/pavelmc/Si5351mcu and he references the library of Hans Summers and says his is the smallest and simplest. I like small and simple at least for an initial foray into experimenting so I will use Han's at first to get things working. Why would you use a more complex one? perhaps to avoid clicks when you change frequency, to access frequencies outside the normal range or to generate two frequencies that are identical but with one a quarter cycle behind the other, i.e 90 degrees out of phase, this can be handy for experimenting with SDRs. There is also code to generate FT8 and other digital modes directly from the chip to make minimal chip count transmitters, e.g for WSPR. But let us concentrate on simple VFOs for now. Once you have "simple" working you can go back and try "complex". After making a simple VFO, I will make a complete WSPR transmitter and then make the VFO subsystem for the uBitx (it generates 3 VFO signals and drives either a text based LCD or a graphics TFT display. As I mentioned above, The subsystem is so popular it is sold as a module called a Raduino.
Han's code is found at http://qrp-labs.com/synth/si5351ademo.html and he gives 4 examples. His fourth example is particularly easy to follow; it was actually written by Christophe, OE1CGS and is a mere 155 lines long.
His code has 4 or 5 useful functions, examples of these are;
and one other function used internally. (Si5351a_Write_Reg())
- TX_OFF(); // you do not need to pass this function any other data
- SetPower(4); // pass this the digits 1,2,3 or 4 to set 2,4,6 or 8mA output
- SetFrequency(10140000); // set the output to 10.14MHz, insert your own numbers
- TX_ON(); // you do not need to pass this function any other data
- SetParkMode(); // moves the output to 150MHz where it will do no harm
These function names are self explanatory (as all function names should be) the SetParkMode() puts the VFO on 150MHz, a harmless output perhaps. The code also references an Arduino library called wire but this is setup by default so, should be available without any user configuration in the IDE.
I will use this code initially to get an output and then modify it to allow typing in a frequency on the PC keyboard. I can them test the output with a frequency counter and scope. I am interested in the strength of the output, in terms of its voltage and the internal impedance of the Si5351a, there is some confusion about this in the press. I also want to note how the output varies with frequency. I can then set about making a more complicated VFO, with three outputs and controlled by a rotary device and a few pushbuttons as well as driving an LCD - the Raduino is used in the uBitx for example.
I wired up a NANO Arduino and a Si5351 as you can see in the photograph below;
Ignore the top yellow and orange wires - they go off to a GPS module, see next month!
The twisted wires go off to a frequency counter and oscilloscope.
I downloaded the 155 line program and ran it - the frequency counter showed 9.388MHz and then I realised the code assumed a 27MHz crystal but my Si5351a had a 25MHz part (I bought it from Adafruit, not QRP-LABs). Altering the constant in the code to 25000000 resulted in an output that was 11 Hz low, Success, I can tweak the 25000000 a bit to make the output exact.
The main part of the code, not including the various functions written by Christoph OE1CGS is

I edited it to a simpler version;

And low and behold, the frequency meter read ;

11 Hertz low, output is stable to with 10 Hz, assuming the frequency counter is itself stable. A good start; the output was 3 volts peak to peak with no load attached and just under 1.5V pk-pk with a 50 ohm load in circuit, this is 500mV RMS which is about 5mW or 7dBm. Slightly weak for a diode mixer but would do at a pinch.
To allow inputting a desired frequency from the PC keyboard, in the serial terminal that is in the Arduino IDE I used the following code; Note whilst I am an old C programmer I am new to writing Arduino code - I am still experimenting (mainly reading other people's code and borrowing chunks... imitation is the sincerest form of flattery).

So there you have it. An Arduino Nano, a Si5351 module and 4 wires and you have a signal generator, outputting 3 volts peak to peak unloaded and 1.5 volts peak to peak into 50 Ohms.
I actually have to make an AD9850 version to act as a sweep generator for the RSP1a SDR that I use for my spectrum analyser. but that is another story.
Next month I will add a GPS and LCD to the mix - a standalone WSPR transmitter.
In the old days if you wanted to work with microprocessors (tiny computers designed to be embedded inside other products) you had quite a lot to learn, a complete subject to master. Because people just wanted to use the things and not get a university degree, modules were designed to make life easy. The Arduino team took a microprocessor made by Atmel - the ATMega328P and put it on a board that had convenient connectors, and an LED as a training aid as well as serial communication to a host computer.
The Arduino Foundation also took the software development toolset and drastically simplified the view of it that the users saw, the Arduino programming environment is a nice snug and cosy minimalist screen of text that is easy for non programmers to use. The key users were artists who just wanted a gadget to do something but the simplicity of the software and hardware, the convenience of assembling both code and hardware was so good that many groups of people adopted it. Makers and amateur radio homebrewers to name a few.
I
used the phrases Arduino Team and Arduino Foundation in the text above,
the exact status of these is not easy to determine and things have
changed over the years. There is a "for-profit" company that
manufactures hardware;- Arduino AG and the intention is to have the
software tools produced by the Foundation. There is an extensive list of
people involved and it all began in Italy with Massimo Banzi and four others.
As usual Dr Google helps with research and Wikipedia is a useful resource which usually carries the "truth", take a look at https://en.wikipedia.org/wiki/Arduino for more background. The full story is listed there, with all the main people, sinners and saints listed.
What
is important is that the Arduino hardware is open sourced and anyone
can download the details and copy, and even sell boards. You can buy an
"official" Arduino from the Arduino shop (http://arduino.cc
) or a clone from Ebay, either a cheap Chinese version or from more
reputable company like Seedstudio, Adafruit or Sparkfun. Seedstudio is
actually a Chinese company but makes high quality products. If you buy
official Arduino boards from Arduino you are contributing to the
ecosystem. See the Arduino.cc site for more details. The word Arduino comes from the name of a local pub near where the first board was designed!
The
first board was the "Arduino Serial" but the first one to really catch
on was the Arduino UNO. (Most names are Italian, because that is where
Arduinos began). It is not my intention to make you an Arduino expert as
there is now a plethora of boards and some have moved on to more
powerful processors and include Wifi and other goodies. The original UNO
is still very popular but a lower cost smaller version called the Nano was
produced and a more powerful bigger board with more memory and I/O called the Mega.
These three will take you a long way. I have Megas in my 3D printers and
CNC machine controllers and nanos in some home made testgear. If you buy an arduino board study carefully how to power it. Some are 3.3v and some are 5V and they allow several ways to supply power, some with voltage regulators and some without. Caveat Emptor.
So, the Nano;

The
standard "pinout" of the Nano looks complicated; it is complicated! but
focus on one thing at a time, we need to apply power and connect a
couple of wires for most projects.

In fact to prove you have a working system all you have to do is plug in the mini USB lead as it can supply power and allow programming your first program. Called "Blink".
You install the Arduino software from the Arduino.cc site - there are two current versions, either version1.8.19 or version 2.0. I refer to version 1.8.19 below, it is slightly simpler.
Before looking at the software and the Blink program in more detail, here are some photos of the other common Arduino boards. The Uno and the Mega.

This is actually a modern "version" of the UNO called a Leonardo. Its basic size and input/ output capability is the same but it has better USB communications (and a different type of USB connector). All UNO boards and their variants look much like this. The main chip may have more internal memory, either more program space or more space to store data. (or both)
The Leonardo provides 32 connection points on the two rows of pins. Some can be used for applyng power, or use the USB connector, or the 2.1mm barrel DC connector. As with the Nano you can (MUST) configure a pin to the correct function, this might be a simple output that can he "high" or "low" - a digital output for lighting LEDs or switching relays on or off for example. Or you might configure it as a simple input that can detect "high" or "low" - a signal from a switch or thermostat sensor for example. Or you can configure some (but not all) pins to receive a actual voltage which must be within zero to the power supply voltage, either 3.3V or 5V depending on the Arduino. The voltage can be read to within 0.1%. You can also configure some pins to output square waves that can vary in frequency or in the percentage that they are "high" or "low" (called the mark to space ratio, a term that relates to ancient telegraphy!).
The next board in the Arduino family is the Mega, again they have several versions depending on internal memory size, set by the actual microprocessor chip that is on the board.

I will not list all the input/output capabilities of the Mega, it is a long list!
I did come across a poster with the history of the Arduino at a very good Australian site, click https://core-electronics.com.au/guides/history-of-arduino/ for the original; thanks Sam. It is best printed as an A3 sheet so I do not reproduce it here.
Modern hardware does little without software (configuring the hardware to do something) and traditionally the configuration begins with a text editor to produce a simple text file that is input to a program that reads the text and works out what to tell the hardware. This is what a compiler does, the combination of the text editor and compiler is a basic integrated development environment, an IDE. The Arduino IDE now has two versions; version 2.0 looks prettier and has extra features to make your life easier. More complex IDEs in general have built in help and extra tools that are even more useful but take longer to learn. Invest the time if you are going to use Arduinos a lot. Version 1.8 looks like this;

Just 5 buttons on the toolbar (and you will only probably use 2 of them!) The first button (the black tick inside a blue circle) converts the text in the white box into machine readable code that configures the machine and runs commands in sequence i.e a "compiled program" the second button (the right arrow inside a blue circle) moves the compiled program into an attached Arduino and allows it to start running. This is called "Download and execute". The black window and the bottom line give progress and status messages as the software operates. There is a separate window used for serial communications.
I have simplified this a bit, but that is the essence. If you are only using other peoples programs you load their text into the text editor (the white area above) and click two buttons (you can even get away with clicking one button as the download button will also compile if you have forgotten. (the IDE tries to look after you!).
There are two other steps needed to setup the IDE before you begin, you need to attach your Arduino board using a USB cable and you must tell the IDE which board you are using. what COMM port the USB has decided to use and possibly what processor is on your particular board. There may be a need to specify any libraries that a particular program might use but if you download someone else's program they should tell you if you need to do this.
Note the white box above has some initial lines of text, you overwrite these with your own program but they are useful to look at now; you should realise that compilers (and computers) are actually very stupid and have an annoying need to be told absolutely explicitly what to do, you cannot be imprecise and expect them to know what you meant, as opposed to what you typed or said.
When I began programming (in a language called FORTRAN) I used to misspell the keyword EQUIVALENCE wrongly all the time, the computer always barfed and I always said "Sh1t". You will get an error message but sometimes with cryptic text if you make a mistake and you have to check everything carefully. If you think a program is not working then you are wrong, it is the human typing the program in that is not working! computers always work - they always do what you ask them to do.
Anyway, the text in the white box is a useful example of what is needed, it is not complete. In the Arduino world a program has two sections, a setup section and loop section. In a more conventional computer program there is just a single program and it is up to you to do what is needed, but the Arduino ecosystem makes it easy for you. The IDE uses the name sketch instead of calling the text a program and they describe the language as "wiring" as it connects up hardware in sequence over time as the program runs. I suppose that is less scary for beginners but I do not like these terms.
In fact the "wiring" language is 99.99% the same as one of the standard programming languages, well, it is really a blend of the C programming language and an improved version called C++. A traditional C programmer (like me) has no problem just treating it as standard C with good library support.
Before presenting the first real program I will point out a few things in the text. You do not need to know this if you only ever program other peoples programs but they are worth knowing.
Once the compiler sees two slashes together // it will ignore the rest of that line.
Why is this useful? because you can add notes and explanatory text to help you (or other people) understand what a line or section of code does. I find I am commenting more as I get older as my memory forgets code I wrote a week ago, adding comments helps. You can also write comments by prefixing and suffixing text with the delimiters /* and */ but the double slash is handier.
The essence of C, or most languages, is that you need actions, a bit like a verb, we call each action a "function" (in other languages sometimes called a "subprogram" or "subroutine"). Most programs do a function, then another function, then another function, a sequence of functions are executed to get the hardware to do something. It is good to have a lot of small functions rather than one big one. Good style is important, when teaching programming I used to insist a function must be shorter than an A4 page. Sometimes you do one thing or another, so you have to test some input or condition and do one function if the condition is one value or a different function if it has a different value.
That is how I describe a program to people who have never programmed before, I also point out that if you have made a pot of tea you have executed a series of functions (you do warm the pot before adding the tea don't you?) The modern term for what a program does is an algorithm.
Functions in C are named, hopefully sensibly! they are sometimes preceded by a special word, have a couple of round brackets that might or might not have some words between them and then have a curly bracket '{' followed by the body text of the function and then a final curly bracket '}'.
C was originally meant to be a programming language for programmers, not an initial learning language, hence it is a bit terse. I much preferred the Algol, Pascal or Modula languages where you use the actual world "begin" and "end" instead of '{' and '}' although it did mean more typing.
So the template above should make more sense now, the special word void means the function just does something, if you were writing a function to work out the temperature of something then the function needs to return a number and then the void word be replaced with a word indicating what type of number the function creates - a whole number or one with a decimal point (don't worry about this for now, the secret to learning a lot is to learn a little, over and over again) The real secret to being a programmer is "the management of complexity"
A real program is included in the examples folders installed when you install the IDE. In fact there are dozens of examples given, do not sit and read them all or your brain will fill up. Under the folder "BASIC I/O" you will find the BLINK program (more correctly called the blink sketch); here it is
# define LED_PIN 13                  // Pin number attached to LED.

void setup() {
    pinMode(LED_PIN, OUTPUT);       // Configure pin 13 to be a digital output.
}

void loop() {
    digitalWrite(LED_PIN, HIGH);    // Turn on the LED.
    delay(1000);                    // Wait 1 second (1000 milliseconds).
    digitalWrite(LED_PIN, LOW);     // Turn off the LED.
    delay(1000);                    // Wait 1 second.
}
Of course, we must examine this one line at a time; do not be too disheartened at the amount you need to learn, the C programming language only has 35 odd keywords, much less than most languages, (although there are a lot of libraries)
# define LED_PIN 13 // Pin number attached to LED.
Any line beginning with a '#' is telling the compiler to do something, there are only a couple of valid '#' commands, the # define tells the compiler to do a text substitution, anytime the word LED_PIN is seen from now on the compiler is to substitute the number 13 for it. Why do we do this? so we can use the more understandable word LED_PIN in our text and humans will understand it better than 13. In a large program we lump all the # defines together and if we move the program to a different board which has its LED on pin 15, we need only edit the single # define line in our program rather than searching and replacing every time the number 13 appears (in the right context) and changing it to 15. My 3D printer arduino code is 15,000 lines long and making a change in it would be tedious if hardware specific things were not isolated to one section (or one file) of the program.
void setup() {
    pinMode(LED_PIN, OUTPUT);       // Configure pin 13 to be a digital output.
}
The setup function of the blink program simply calls the pinMode function and passes it two pieces of information, a pin number and what mode we want that pin to be configured as, in this case pin 13 is configured as an output. We need to know the pinMode function exists and what its options are, look up https://www.arduino.cc/reference/en/ to see the other things PinMode can do.
By the way, every time you use a function you must put a semicolon after the final round bracket. When you write a function you put a '{' after the final round bracket. This is so the stupid compiler can figure out if you are giving it details about the function - its guts (usually called the "body" of the function) or whether you are using it. You only need to give the body of a function once but you can "call" or use a function as often as you like. (e.g we call the delay function twice in the blink program)
Nearly there; only two more functions to understand!, the second of these is the delay function. Guess what? it does what it says and simply waits for 1000 somethings, the program documentation says the delay function takes a number of millisecs so delay(1000); means wait a second.
I will leave it to you to figure out what the digitalWrite function does, you must pass it two things and it is documented in the help system https://www.arduino.cc/reference/en/ or click the Help top right menu item in the IDE.
To use the board, connect it to your PC via a USB lead. your PC should install drivers and allocate a virtual serial port. Some clones need you to manually change drivers but proper Arduino hardware shouldn't. In my case the default drivers loaded and I started up the IDE. The menu line at the top of the Version 1.8.19 IDE has File, Tool and Help entries as well as two others.
Click on File->Examples->01.Basics->Blink A new IDE window should appear, close the first one and click on the new one.
Click on Tools->Board:->Nano
Click on Tools->Port:-> "whatever port your NANO got installed on" COM8: in my case, yours will be different. If I have difficulty finding the right port I hit Ctrl-ESC and enter dev on the keyboard to run the device manager control panel, expanding the Ports(COM & LPT) arrow will list all the com ports, mine lists "USB Serial Device (COM8) but yours may list others. In any case the bottom line of the IDE should now list the board type and port in very small writing.
You are ready to compile and download the contents of the white window. You can just hit the two buttons in round blue near the top left, but I usually alter one of the time delays in the Blink program from 1000 to 250 or smaller - I can then tell I am executing new code as my Arduinos might have an old blink program within them, so if you want to check out your system by actually compiling and downloading a new program then this is better. This is called "Verifying the toolchain" and means you have a working development environment to use your board. A good start.
Clicking the first button (with the tick in it) should bring up the word "Compiling" and a progress bar on the blue bar at the bottom of the white window. After a few tens of seconds this changes to "Done Compiling" and the black window has a few messages about how much memory the program uses. Unless of course you made a typing mistake. Even a trivial mistake stops compilation, an extraneous comma or a missing semicolon will break things. You must be absolutely precise. OCD even. You can type "white space" as C mostly does not care about indenting or new lines (some languages such as Python do).
Clicking the second button, the right arrow in the blue circle brings up another "compiling" message followed by "Downloading" and the black window shows a lot of messages, finally the LED Blinks!
note some Arduinos require you to press a button on the Arduino board a split second before hitting the download button.
Hopefully this is a useful very basic overview of how to use an Arduino, a helicopter view. for sure you will probably need to follow more detailed tutorials and/or YouTube videos (or even a book!) but I have shown how it is not actually that complicated. Next month I will describe my experiments with a Nano connected to a Si5351 chip to make a VFO - similar to the system used in the uBitX.
Return Loss Bridges
RLBs can be used to measure antennas to see how close to 50 Ohm they are (what VSWR you can expect), they are also used to measure the input and output impedances of amplifiers, filters and other circuits.
A bridge made with half watt resistors cannot be used with a high power signal so you shouldn’t leave it in circuit when you want to actually use an antenna (you waste 75% of the transmitter power) so a SWR meter has some advantages over an RLB.
You can work out how an RLB works using transmission line theory or Ohm’s law, I prefer Ohm’s law.

A return loss bridge (RLB) is a simple 4 resistor bridge, with one of the resistors omitted - you put the device to be tested in its place. The abbreviation DUT is often used - the Device Under Test.
Two equal value resistors in series will divide the voltage across them
by two (provided little current is drawn away from their midpoint) If
the device to be tested is a 50 Ohm resistor then the voltage at point A
will be the same as the voltage at point B. The voltage between points A
and B will be zero
Applying a signal from a signal generator when the DUT is an accurate 50 Ohm load should give no reading(or a tiny reading near zero) at the detector output, everything is balanced and the voltage between A and B is zero.
Shorting the DUT terminals (or leaving them open/disconnected) gives a maximum voltage - the limit of what the bridge can generate. Attaching an actual DUT will give a voltage between the maximum limit and zero.
If the device is not 50 Ohms you can infer the impedance of the Device to be tested depending on how far away from the limit the detector sees. The limits when a real bridge has an output with the DUT left open or shorted, is a important reference and we divide it into the reading we get with the DUT connected. The open or short readings should be similar, within a dB or two. Use either, or halfway between them as the reference.
I say divide, but if the detector readings are in dBm we actually subtract the readings because dBms (or dBVs) are logarithmic numbers and you add or subtract logs to multiply or divide numbers. Don't worry about the theory, the practical things you need to use an RLB are straightforward. You take 3 or 4 readings and do a couple of subtractions.
A real detector output needs a Balun or choke to allow it to measure things with respect to ground. See the QST article at https://www.qsl.net/kl7jef/Build a Return Loss Bridge.pdf ; it is an excellent read and I reproduce some of its content here.

The two coils allow the measuring device to have one of its terminals at ground which is much more convenient that designing a differential input detector. You can also use a common mode choke, it acts to convert a balanced signal to an unbalanced one – as a Balun. You can make this with a large number of expensive ferrites or use a broadband ferrite transformer; the more expensive option works over a broader range of frequencies.
As I said above, we can convert voltages to dBV and subtract them instead of dividing the numbers – the answer is in dB. These are voltage ratios so you use 20 times the log of a voltage to get dBV. If your detector reads power in dBm directly, you can still subtract the two numbers and get dBs
In practice the zero point is never perfect, there is always some leakage, particularly as frequency increases so you should measure the (small) output when connected to a good 50 Ohm load. The difference in dB between the open or short case and the 50 ohm case is called the directivity of the bridge, how good it is. You cannot measure return losses greater than the directivity. Home-made RLBs might only have a directivity of 25 to 30 dB, commercial ones are higher 40db+ I got 35dB on my home-brew RLB using a single ferrite core (an FT50-43) at HF frequencies near 14MHz, I have yet to sweep it from 3.5 to 54MHz.
When you subtract your reference in dB(V or m) from the reading of something you want to test you get a negative number of dB because the reference is always bigger than the reading of your device under test. This number as a positive number of dB is the return loss and it represents the same thing as SWR but expressed in a different way. A table allows conversion. This is handy if your device under test is an antenna as we are used to SWR (technically we should say VSWR). We are used to having an antenna at VHF and above with an SWR of 1.5 or better, certainly better than 2:1. At HF an SWR of under 2:1 is ok and 3:1 will work for some transceivers if they have internal tuners or protection circuitry (that may reduce power a bit). Once you have SWRs getting below 1.2 or so then that is good enough, more accuracy is not needed. Just as well as the RLB can’t accurately measure really really good SWRs- expressed as return losses that are beyond the directivity; the limit of the RLB.

For example, if an open-circuit voltage of 1 volt drops to 0.1V with the device connected, the ratio also called the reflection coefficient, ρ, is 0.1 divided by 1 gives 0.1 and 20 times the log of (0.1) is -20 dB so we say the Return loss is 20dB and the table below gives us an SWR of 1.22:1 (from the Table). By the way ρ is the Greek letter rho and is conventionally used in equations – irrelevant to us if we just use the tables…
If your detector is a spectrum analyser you can take readings in dBm, if you get -10dBm when reading a short and -30dBm when taking a reading then the subtraction gives (-30) - (-10) which is -20, Return Loss is 20dB.
If your detector is a crude diode detector feeding a DVM then you need to take two readings, adjust your signal generator to give a high output when the device is connected, replace the device with an open or short and connect and adjust an attenuator between the signal generator output and the RLB until the diode detector has the same reading, the attenuation set is the return loss. The same trick works if you use a receiver with an S-Meter as the detector but switch off the AGC.
Note I like specifying Return Loss as a positive number of dB, a “LOSS” of 20dB is a reading of (-20)dB. However some people say the RL is -20 dB, including some manufacturers <sigh>. It is usually clear what is meant. Likewise it does not matter what reading you subtract from what as long as you write down the answer as a positive number of dB.
Antennas are easy to measure with an RLB although you obviously can’t leave the RLB in circuit when you connect up your transmitter so an SWR meter is handier, but an RLB can also measure coax loss, see the QST article listed above. You can also measure input and output impedances of amplifiers and other devices. You can see the passband of filters as it is the band of frequencies where the RL is high since this is when the input impedance is near 50 Ohms. Filters have much bigger or smaller impedances outside their passbands - they reflect the energy back and do not pass it. Unless it is a diplexor.
You can convert RL and SWR to an equivalent impedance using the formulae below, but of course a table is handier. I referenced the website https://www.yagicad.com/Bridge1.pdf for this;

The ratio of the voltages Vtest/Vopen is ρ (conventionally the greek letter rho), it will be less than 1.
So Return Loss RL = -20 Log10(ρ) You can also measure RL with a VNA, it is the same as S11 but with the sign changed S11 is usually a negative number of dB.
You can use the table above or below to convert S11 from a VNA to SWR but note the NanoVNA can do this for you using its display routines (not all VNAs do).
You can also rearrange the formula | ρ | = | (Z0-Zx)/(Z0+Zx) | to get Zx but again the table is easier.
Note all these measurements only work if the internal impedance of the signal generator and detector is 50 Ohms. If it varies a bit with frequency then you can use an attenuator between the generator and the RLB to bring its impedance nearer to 50 Ohms. Likewise if you are unsure of how good the 50 Ohm internal impedance of your detector is then you could add an attenuator between the RLB and it. The detector can be a spectrum analyser, a power meter, or just a simple diode detector feeding a DVM or even a receiver with an S-Meter but you must have accurate 50 Ohm internal impedances in your detector and signal source.
As mentioned in previous articles you can measure both input and output impedances (or return losses, or SWRs) at the input and output of amplifiers. Measuring Input Return Loss is straightforward as shown below. Remember to take a reading with the RLB device port shorted or open before connecting up the amplifier. The amplifier is the shaded triangle below. You are measuring the RL at a low power, if the amplifier is linear (class-A) then this is valid.

Measuring output return loss is a bit more complicated and risky although I haven’t blown up my SA yet! It is a theoretical risk, if you don’t check you will “probably” be all right… you force signals into the output. You MUST have a dummy load at the amplifier input, hopefully to ensure the amplifier itself is generating no output.

To test Output Return Loss you should first check that the amplifier is well behaved. Before connecting the RLB to the amplifier output, connect a dummy load to the output and a scope or a spectrum analyser (through a big attenuator) on the terminated output and check the amplifier has no output when its input is also terminated in a second dummy load. If there is instability in the amplifier it could be oscillating and generating its own spurious signal and outputting it despite having an actual input of zero.
Make sure the amplifier has a capacitor or transformer at the output so there is no superimposed DC on the output (do this any time you use a Spectrum Analyser although some have DC blocks provided, not all do).
You can use a RLB with low power resistors in these tests, even when testing higher power amplifiers. Once you move away from linear Class A amplifiers you are probably better testing SWR at rated output instead and adding a suitable inline SWR meter at the input of the amplifier – fed from a medium power driver amplifier which you should characterise (measure) first. I hope to experiment with an alternative load pull technique when I build higher power amplifiers that are not Class A; this involves using two dummy loads with slightly different values and solving simultaneous equations. I haven't seen this is any textbooks and it needs a detailed analysis of measurement errors. These may contrive to make the results too inaccurate if the two loads are too close together.
Once you have the return losses you can convert them to impedances and redesign or adjust matching networks as required. Note RLBs only give you the magnitude and not the phase differences of Zin or Zout. You want a magnitude of 50 Ohms in most designs. An RLB system is a SNA (Scalar Network Analyser) whereas a VNA is a Vector Network Analyser and can give you impedance as a complex number.
Practical Tests
Here are photographs of my homemade RLB and also a £10 ebay version. There is a similar version from the web at https://www.k8iqy.com/. He gives the schematic too – it comes from the EMRFD book that I so often quote. I used a FT50-43 with 13 bifilar windings of thin enamelled wire. It is fine between 3MHz and 50MHz (good to much higher actually but I am only building a 3 to 30MHz uBitx at present).

Here is my construction, I made a box out of PCB material, as small as practical. I also superglued a small square of PCB material to the floor of the box as a connection point.
I used pairs of 100 Ohm resistors connected in parallel to get 50 Ohm resistors, you could also use 51 Ohm resistors and accept a small inaccuracy.
I have soldered the remaining side and the lid on although I didn't see any difference in readings with the lid on or off.
All my readings were done at 13.035MHz but I have ordered a DDS signal generator and will make a sweep oscillator for my Spectrum analyser (My RSP1a SDR) and repeat for 3 to 50MHz (or higher). My Ferrite will be poor below 3MHz...


The Ebay version uses a common mode choke with lots of ferrites – better at higher frequencies
.jpg)
Note this needs R3, the third resistor added on the REF - reference port – you should add a 50 Ohm SMA dummy load – easily bought on EBAY. It needs to be very compact to work at 3GHz. You can use this RLB in 75 Ohm systems by using a 75 Ohm reference. You will also need a second dummy load to act as a load at the input or output of any amplifier you test, as per the diagrams above. You also need a shorted SMA and/or a open circuit SMA connector, though at HF you just leave the DUT unconnected, You take two readings and subtract them.

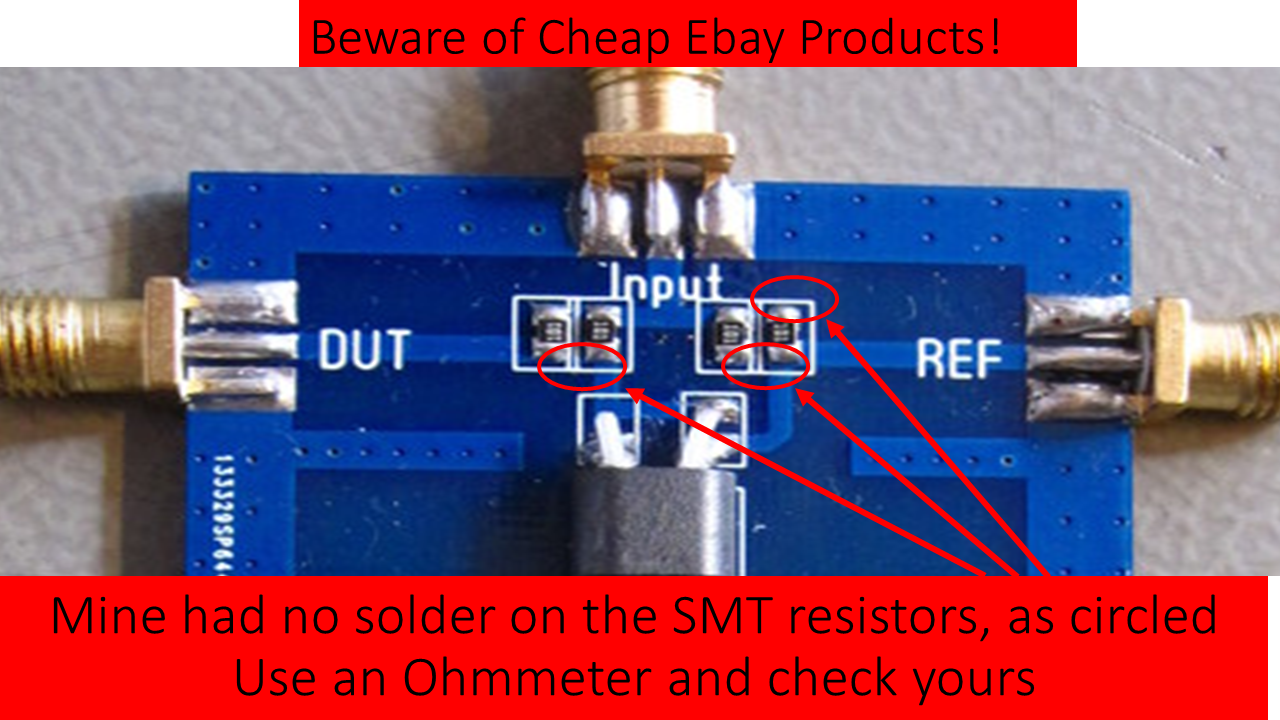
The version I bought from Ebay had a mistake in its wiring; the soldering was faulty, I had to add two wire links to parallel each pair of the 100 Ohm surface mount resistors. You can see them in the close-up above, I also re-soldered the top pads of one of the SMT resistors as there was almost no solder under the pads! Use the circuit diagram above and a simple Ohmmeter to confirm your connections. You should see 51 Ohms on J1 if only Rref is connected as R3 is floating and R2 is shorted by the balun. The resistance from J2 should be 100 Ohms since you are measuring through R3 and R1.
I then measured -14.5Bm with the DUT port open and -12.7dBm with it shorted, when I connected a 50 Ohm dummy load I got a reading of -51dBm, the open and short readings should be close to each other and using an average (which is not correct mathematically but it is handy) this gives about 38dB of directivity at 13MHz, this is very good, anything over 25dB is good enough, even 20dB is useful.
Hopefully you can see that RLBs are very simple devices, perhaps with less simple mathematics behind their use but be confident that using tables and ignoring the maths is easy. They only give the scalar value of return loss, the impedance is just in Ohms (if you convert the RL using the tables above) you do not get any phase information. There are two values of Ohms as well, above or below 50, you do not know which is the actual value, but as your aim is to adjust matching circuits or antenna lengths to get near 50 it doesn't matter which it is. The nanoVNA is better in this regard, but you can use the RLB to verify that the nanoVNA is giving viable readings. I like to have two ways of doing things!
Also worth knowing is that these RLBs have other uses; they can combine two signals and produce a single output where neither of the two signals interfere with each other. My two tone generator has one inside it.
Now to the results of testing the TIA amplifiers from the uBitx using both of these, a previous article showed the results of measuring S11 and S22 (S11 looking into the output port). I did these (too) quickly and so I have redone them here, I took more care that there were no loose connections and didn't touch anything during the tests.
I don’t have a tracking generator yet so I just took readings using one tone of my two-tone frequency generator (13.035MHz). You take a reading with the DUT port open or shorted and then a second reading with the amplifier connected to the DUT port and the dummy load connected to the other port of the amplifier. You subtract these two readings to get the return loss. You should also take a third reading with a dummy load connected and subtract this from the shorted or open readings as well, this is the biggest RL you can measure.
Result:
1. Measuring Zin of the TIA amplifier.

Using my homemade RLB, with a 20dB attenuator at the output of my signal generator and a -10dB attenuator on the input to my Spectrum analyser (SDRPlay's RSP1a) Gave readings of;
(i) DUT Port Open = -42dBm (ii) DUT Port Shorted = -42dBm
(iii) DUT Port to 50 Ohm gave -77dBm which is a directivity of 35dB ( i - iii)
(iv) DUT Port connected to input of TIA amp gave -68dBm so return loss is 26dB (iv - i )
This RL is bit low - in this test the amplifier is actually amplifying the test tone and I think this increases leakage which means the SA detector gives a reading higher than the true reading. Maybe I need a metal test bench or better shielding around the SA (the RSP1a SDR receiver). On the other hand 26dB is still a "good" value, good enough to not need matching circuitry...
Using the EBAY RLB gave slightly better readings and its directivity was better;
(i) DUT Port Open = -43dBm (ii) DUT Port Shorted = -43dBm
(iii) DUT Port to 50 Ohm gave -84dBm which is a directivity of 41dB ( i - iii)
(iv) DUT Port connected to input of TIA amp gave -74dBm so return loss is 31dB (iv - i )

2. Measuring Zout of the TIA amplifier. (Again with 20dB, not 6dB attenuation, and 10dB at the SA)
The homemade RLB gave a reading of -75dB which is a RL of 75-42 = 33dB
The EBAY RLB gave a reading of -74dB which is an RL of 74-43 = 31dB
The NanoVNA gave an S11 reading of -32dB, |z|=48.9 or a VSWR=1.05. If we were pedantic we could describe the S11 reading as an S22 reading as that is what you get when you look into the output port of a system under test
In summary all three methods are close enough, the lower input RL with the homemade bridge is probably due to leakage around the cables, but 26dB is still a very good Return loss and all these systems get better as the return loss gets worse. Also the TIA amplifier is working! time to get the VFOs going and then I am ready to make a uBitx - the receiver part.
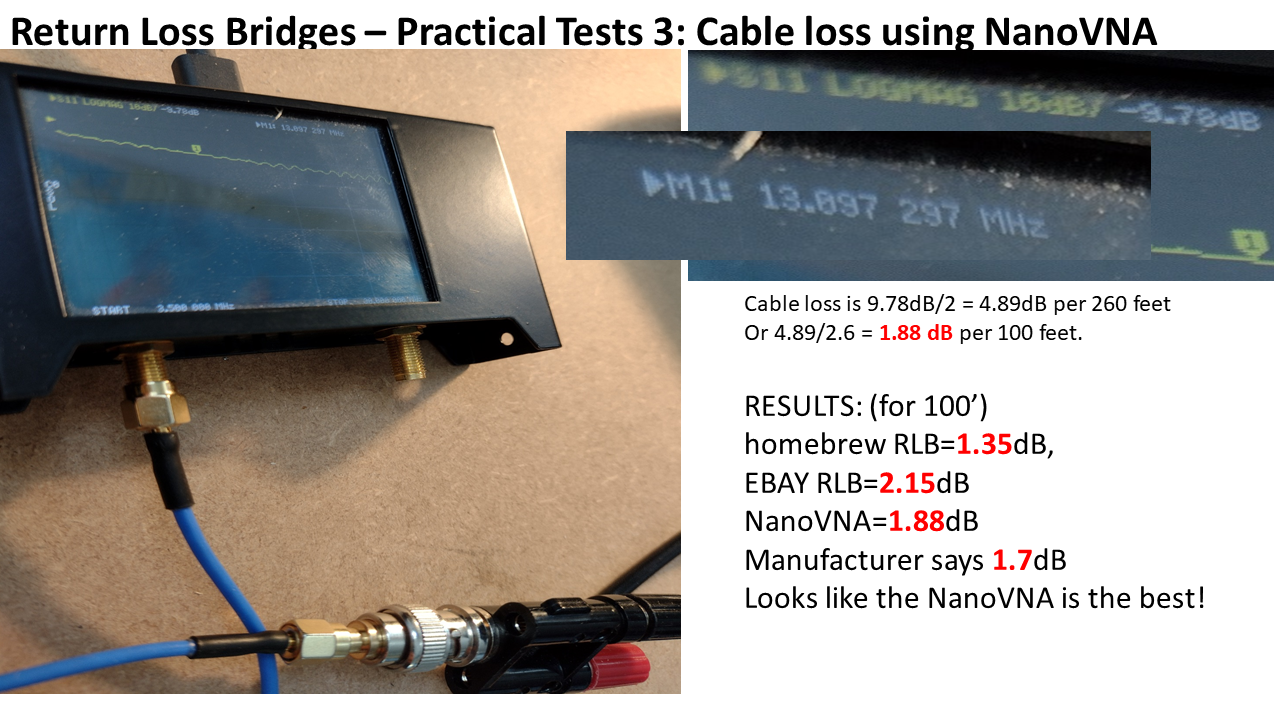
Note, a few weeks after I first posted this, I gave a talk to my Radio Club, and have copied the slides to a further post here on RLBs, there is some duplication but I used the RLBs to measure coax cable loss. Look for a post on 12th October, 2022
An Amplifier amplifies! a small signal going into the input produces a bigger signal at the output. What are the relevant details? The parameters that matter.
Gain: a gain can be expressed in several ways and you must be clear if it is Voltage gain or Power gain. If the input impedance and output impedances are the same then these are simply related. If not you have to convert from one to the other at the input and also the output and manually work out each gain separately, simple enough using Ohm's law
Gain can be expressed as a number such as 10, again, you need to know if this is a voltage gain or power gain. If one amplifier is followed by another then you multiply the gains - if expressed as numbers. If the second amplifier has a gain of 8 then the combined gain is 80. It is also common to express gain in decibels, these are calculated by taking the logarithm of a gain number (and multiplying by 10 if it is a power gain or by 20 if it is a voltage gain. When you have two amplifiers connected together and you know their gains in dB you add these to combine them - if one has a gain of 10dB and the other has 9dB then the combined gain is 19dB. Addition is easier than multiplication which is why dBs are popular.
Bandwidth: The upper and lower frequencies where the gain drops by 3dB, in power terms this is a drop of 50%, in voltage terms it is a drop of 29.9%.
The parameters above are easily tested; a signal generator and oscilloscope will show the voltage response, particularly if you use the oscilloscope to look at the input voltage at the same time as the output voltage. Voltage Gain is Vout/Vin. You can use peak voltage, peak to peak voltage or RMS, as long as the waveforms are the same shape, preferably sinewaves and you are consistent between measuring input and output and there is no distortion. If you express Vout/Vin as a number, e.g 7 you can convert this to dB by taking the base ten logarithm of 7 and multiplying by twenty which gives about 17dB as Av. It is important that the amplifier sees a load at the output, usually 50 Ohms. It should also be driven by a source with the same internal impedance that the amplifier will see when it is used in a final system, again often 50 Ohms. Your signal generator might have two outputs, with a Internal Impedance of 600 Ohm or 50 Ohm. Pick the right one or add an external attenuator.
You don't even need an oscilloscope although you can't just use your DVM or a voltmeter directly since they don't work at frequencies above audio (and maybe not even at audio) but you can use a simple diode detector with your DVM. These can even read power directly - see the RSGB handbook. You could even make a simple signal generator if you are testing on a budget.
if you know Zin and Zout of the amplifier you can work out the power in and power out (Square the voltage and divide by the impedance) and this gives you the power gain. You can express Power Out divided by Power In as a simple number or in dB, e.g if the ratio is 49:1 this is a power gain of 17dB. To convert to dB you take the base ten log and multiply by ten. We usually use power in RF work.
With experience you probably will memorise a few conversions to make your life easier. 3dB is 2:1, 6dB is 4:1, 9dB is 8:1 - do you see the pattern here? adding 3 to the dBs doubles the ratio. Likewise 10dB is 10:1, 20dB is 100:1, 30dB is 1000:1. The pattern here is that the digit in front of the zero of the dB figure tells you how many zeros to put in the ratio after the leading '1'. This is only true for power ratio and the equation 10Log(ratio) As an example, note that 36dB is 30dB + 6dB and this is a ratio of 1000 to 1, multiplied by a ratio of 4 to one so it represents 4000 to 1.
If everything is 50 Ohms you can usually read of the mW or dBm scale of your signal generator. You will need to add a dummy load to the output if you are using a normal oscilloscope. Alternatively you can use a Spectrum Analyser(SA) at the output. These usually have an internal impedance of 50 Ohms by design. The SA has the advantage that its display is in dBm directly. Provided your output is meant to be driving 50 Ohms. You must attenuate the output if it might overload the Analyser. I use a £100 SDRPLay RSP1a and a homebuilt attenuator.
dBm's are the ratio with respect to 1mW so 36dBm would be 4000mW (i.e 4 Watts). dB's are just a numeric ratio, dBm are an actual, absolute power. You will also sometimes see dBV or dBuV. There are actual voltages, not just ratios. I discovered lately that FFTs in LTSpice are displayed in (rms) dBV and you need to add 13dB to get dBms. That is not in the manual!
There are lots of calculators online to convert dB to ratios, dBv, dBuv or dBm or dBWs. You often must know the relevant impedances for these calculators to work, they usually assume 50 Ohms. E.g https://www.rfmentor.com/content/dbm-dbw-dbuv-calculators
It is most convenient if the SA has a tracking generator and then you can get a direct plot of the frequency response. If not you have to pick different frequencies and plot graphs in graph paper or in a spreadsheet (Excel can "join up the dots" for you). If Zin and Zout are 50 Ohms you can use a NanoVNA, and the NanoVNA can even measure/check Zin and Zout. But you frequently need attenuators at both the output of channel 0 (port 1) and channel 1(port 2) of your NanoVNA, the first protects the amplifier (DUT - Device Under Test) and the second the input of the VNA - it needs to be below a milliwatt.
I repeat do not apply the NanoVNA to a circuit unless it can cope with a milliWatt (0dBm or 1mW) Do not apply the output of a circuit to the NanoVNA input unless the circuit is outputting less than a milliwatt. If using a Spectrum analyser or SDR acting as a spectrum analyser this also applies.
If Zin and Zout are not 50 Ohms you can still use 50 Ohm based instrumentation as they will indicate performance if you are going to use the module under test in a 50 Ohm environment - fed by an antenna or other module output with 50 Ohm internal impedance and feeding into the next stage where its input impedance is 50 Ohms. This is how a normal RF system works, 50 Ohm feeds 50 Ohm, if both are the same you get maximum power transferred from one stage to another. And keeping at 50 Ohms keeps the effects of stray capacitance low. If you insert an attenuator (designed for 50 Ohm systems) between stages you restore the effective Zin or Zout back to near 50.
No discussion of Zin and Zout would be complete without talking about alternatives ways of describing input and output impedances - in the RF world we use SWR or return loss (or reflection coefficient) but I will postpone this for now.
Maximum Input amplitude: (Voltage or current) if you double the input amplitude, we expect the output to double as well. Graphically if we plot input against output we expect a straight line at a certain slope (the gain). The straight line cannot go on forever. A real amplifier has a power supply. Normally the output voltage cannot exceed the power supply.
It can exceed the output voltage or current of the power supply if a transformer is used or if an inductor or capacitor stores energy and then gives it back to the output such that its voltage or current adds to the power supply. For instance a single ended transistor with an inductor as its collector load can output nearly twice the power supply voltage. Nonetheless the output should be the input magnified by a fixed number (the gain). Once the output droops you are nearing the limit.
Linearity: related to the maximum input amplitude. There are several ways of specifying this. In the RF world we use two different methods. If we are looking at the graph of a real amplifier and note that the "straight line" droops by 1dB we call this the P(-1dB) point, sometimes the minus sign is omitted (P1dB) it is an example of gain compression. You could meet an amplifier where the output rises by 1dB but it is uncommon (I've never seen one) You probably should not be running an amplifier beyond the P(-1dB) point and if you are at or near it you are generating a small amount of distortion. If outputting speech you are only distorting on the peaks of speech that take you to the P1dB point, the vast majority of the time you are passing a lower, more linear, signal. This does not apply if you are passing Data or using FM - you might be running at peak output all the time, a good reason to reduce amplitude if using data, apart from the distortion you are stressing the amplifier and its heat sink or its omission is, by design, not able to cope with continuous peak outputs. Be careful overusing speech compression as well.
The other performance metric for linearity/Strong signal handling ability is related to Inter-Modulation Distortion(IMD) and specifically the amount of third order Intermodulation Distortion. There is a strange relationship between IMD3 and Power out (Pout). As you increase Pout(by increasing Pin of course) the IMD3 increases three times faster (in reasonable, well behaved amplifiers)
You can graphically plot a straight line for Pout/Pin and IMD3. since the "slope" of the IMD3 line is steeper it will cross the Pout line at some artificially high Pout - remember at some point well before the crossover the Pout line will droop by 1dB and then droop even further until saturating with a straight line - the power supply cannot supply any more power (your devices may well be glowing red hot by this stage and blow up shortly afterwards or before).
The crossover point is never reached, you have to extend the lines by hand on the graphpaper. It is a theoretical point. The power level where the crossover is drawn is called the third order Intercept point and we use the term OIP3 to represent it. (The Output Intercept Point for third order intermodulation distortion).
You can also mathematically move the figure to the input where it is called the IIP3. You simple subtract the gain (since the figures are in logarithmic dB you subtract rather than dividing by the gain). The IIP3 and OIP3 are important even if they are theoretical. It is easy to work out a combined figure when you have a chain of amplifiers and you can calculate when a strong signal will cause distortion. If you are dealing with a single stage the P(1db) is easier to measure.
There is even a rough rule of thumb that the OIP3 is usually about 10 to 12 dB higher than the one dB gain compression point P(-1db), at least if using ordinary bipolar transistors, FETs are usually show about a 7 or 8dB difference. Crude but useful...
Apart from using the rule of thumb you can use a formula based on a graphical technique. If Pout increases at a rate 'x' and IMD3 increases at '3x' then IMD is catching up with Pout at '2x' if you have a specific measurement of both - usually taken from a spectrum analyser then you can calculate the crossover point, the third order intercept.
For example if the Pout is at 20dBm and the IMD3 is 6dBm then if we "theoretically" increased Pout to 24dBm we would expect IMD3 to go to 18dBm - because it increases three times faster (up 4 and up 12 dBm). If we increase Pout another 3dBm then IMD3 goes up 9dBm so when Pout=27dBm IMD3 would be also 27dBm - the crossover point. An easier calculation is to take half the difference between the real Pout and the IMD3 taken at a specific Pin, the difference in the example above 20dBm - 6dBm which is 14dB, half is 7 and we add the 7 to Pout to get 27dBm. This works because the difference between Pout and IMD3 increases is a factor or 2.
OIP3 = Pout + 1/2 (Pout-IMD3 )
We can do this easily using a two tone oscillator and a spectrum analyser.
Other parameters of amplifiers we would like to measure are;
Input and Output Impedances: Easily done with a nanoVNA (it is what it is designed to do) but we must take into account the strength of the VNA output and add an attenuator for amplifiers used for small signals and we might even want to add an amplifier(of known gain and return losses) to test medium and higher power amplifiers under more realistic conditions. Secondly the output of the device under test may be too strong for the input port of the VNA. Luckily attenuators can be knocked up by soldering three cheap resistors in a "pi" or "T" arrangement.
see https://www.rfcafe.com/references/electrical/attenuators.htm
There is an alternative to a NanoVNA that is cheaper; A return loss bridge (RLB) is a simple device, at its heart it is a simple 4 resistor bridge, with one of the resistors omitted - you put the amplifier input or output in its place. Applying a signal from a signal generator will give no reading at the detector output if everything is 50 Ohms and a maximum reading when either shorted or left open circuited. You can infer the impedance of the amplifier depending on how far away from maximum the detector sees. The detector output needs a Balun or choke to allow it to measure things with respect to ground. You can buy a cheap RLB from Ebay for a tenner, or make one for under a quid. (see https://www.qsl.net/kl7jef/Build a Return Loss Bridge.pdf ) The NanoVNA uses this method and has RLBs inside it - but the signal levels and sensitivity are fixed which is a nuisance sometimes. I will do a future article on RLBs.
When measuring Zout you need to terminate the amplifier input with a 50 Ohm resistor, you should check with a dummy load and scope that the amplifier is not outputting anything, if it is you will damage your test gear. I was nervous measuring Zout - you apply outputs from your test gear to the output of the amplifier, it is wise to check the output is zero before connecting up your nanoVNA, RLB or signal generator! With the input shorted to ground through a 50 Ohm resistor, the output should be zero but it is wise to check, a spurious oscillation might be happening (usually called instability - a bad thing!) Also make sure there is a DC block in the amplifier (there usually is). This can be a capacitor or transformer. Don't apply DC to your nanoVNA or Spectrum Analyser.
Measuring Zout in a non-linear amplifier is of limited use, it varies all over the place. You can pick a particular power out and try and measure Zout at this point. If you cannot use the methods described above, a SWR bridge can be of some use. Alternatively apply a load near what you think Zout is, take readings of both voltage and current (record phase). Now make a small change to the dummy load and get a second set of readings, you can model (pretend) the amplifier output is a voltage source and an unknown impedance) at that particular power output, the operating point) and solve simultaneous equations to find it. The answer is only valid at that particular output power and load. You have performed a small signal linearisation about a particular operating point. I think this is called the load pull technique.
Isolation: I shall mainly ignore this, apart from one particular parameter. Some amplifiers have an annoying feature where if they are outputting to a device whose internal impedance varies then you experience variations in input impedance, an amplifier is said to be Termination Insensitive if it doesn't do this.
The particular amplifier I am testing here is known to be a TIA - a Termination Insensitive Amplifier I have simulated it in LTSpice, It is a bit fiddly to measure it in real life. You need to take a number of Zin and Zout measurements with differing load impedances. I will use 25, 50 and 100 Ohms and see what happens.
Noise figure/ Noise factor/ Noise temperature: These measure the same thing and are related to each other by simple formulae. I am still working out how to do this. The traditional method uses a noise source of known value (a "calibrated" noise source) and takes two readings, with it switched on and off. I do not yet have a source and they are expensive. The related topics of measuring Signal to noise ratio and sensitivity( Minimum Discernible Signal (MDS)) can wait until I have a complete receiver built.
Power Consumption/Efficiency: The output power and the power consumed by the Power supply contribute to the efficiency. Easier to do with simulation than actually measure. More important with the final power amplifier. To discuss this we should discuss amplifier Classes. Remembering that it is hard to generate an output voltage that is bigger than the power supply. (or twice the supply if you have collector/drain loads that are inductors)
A simple amplifier with a sine wave applied to it has an input that swings positive and negative (and usually passes through a capacitor). In a single-ended power supply, e.g +12V and Ground. The output can probably only swing plus or minus 6 volts. (actually 0 to +12V but if you use a capacitor you can consider it to be AC.) This means the amplifier output is sitting halfway between 0 and +12 when no signal is applied. This usually means there is base current bias applied and the transistor is half on. If it is half on, it is wasting power and the power consumption is maybe 50% of what you see with a big signal passing through.
However, at least the output is faithfully following the input even if several times bigger (the gain). This shows linearity. That's class A. I will discuss the other classes when testing high power amplifiers. Most transceivers use Class A for all but the final transmit amplifier to minimise distortion, we accept some distortion in the finals to keep the power consumption efficiency low where consumption is likely to be highest.
A recent topic is that power consumption efficiency matters in the first stage of a receiver. It affects battery life if you are portable. An easy but inefficient way to get good strong signal handling and coping with nearby strong signals whilst receiving weak signals is to pass a high standing current (known as the quiescent current) down through the active device, or to parallel the active devices - some high end receivers use four FETs in parallel - and hence consume four times the current, Might only involve less than 100mA but it will affect battery life. So a compromise must be reached and it is worth measuring the power consumption when testing an amplifier.
---
Here are some practical tests I undertook on the three transistor TIA amplifier used in the uBitx, the unit I tested had the 2n3904s swopped for BFW93s to improve noise figure. I also simulated the circuit in LTspice.
My first test was to measure OIP3, I used my homebrew Two Tone Oscillator with its output reduced by variable attenuator set to 30dB and fed the amplifier to the Spectrum Analyser - after checking it was below -10dBm where the SA has better linearity.
I got the waveform below;

So the Pout of the first tone, f1=13.035MHz is -12.9dBm and the IMD of twice f1 minus f2 is -67.7dBm (at 13.021MHz). The OIP3 is (Half the difference of the IMD and POUT) - POUT
i.e (67.7-12.9)/2 + (-12.9) = +14.5dBm,
not brilliant but ok. Perhaps the BFR93AW are poor performers, I will repeat the experiment with 2N3904s. I ran the BFR93AW version with 35, 25 and 40 db of attenuation and got OIP3 of +12.8dBm, +14.25dBm and +12.15dBm. The slightly worse figures at low signals might be evidence of some leakage direct to the SA so a figure of +14.5 dBm is probably the right one. (They should all be the same)
My next measurements used the NanoVNA, I used an inline 20dB attenuator, sometimes on the input, sometimes on the output of the amplifier.
S21 is the gain, but as I had a 20dB attenuator in circuit the gain is actually +14, nearly +15 dB and the frequency response is very good - In real life I will have filters either side of all the amps so the three dB points are irrelevant.(I think)


.png)


